Repeated administration effect of Superolein based intravenous lipid emulsion on lipid metabolism and liver metabolites of New Zealand White Rabbit
Mohd. Haz Hairul Amran1,2*, Mohd. Hanif Zulfakar1, Syarul Nataqain Baharum3, Ahmad Fuad Shamsuddin1,4
1Centre for Drug Delivery Research, Faculty of Pharmacy, Universiti Kebangsaan Malaysia, Kuala Lumpur, Malaysia
2Pharmacy Production Section, Department of Pharmacy, Hospital Sultanah Nur Zahirah, Kuala Terengganu, Malaysia
3Centre for Genome Analysis and Technology& Centre for Plant Biotechnology, Institute of Systems Biology, Universiti Kebangsaan Malaysia, Bangi, Malaysia
4Faculty of Pharmacy and Health Sciences, Universiti Kuala Lumpur Royal College of Medicine, Perak, Malaysia
*Corresponding author: Dr. Mohd. Haz Hairul bin Amran, Hospital Sultanah Nur Zahirah, Jalan Sultan Mahmud, 20400 Kuala Terengganu, Malaysia; E-mail: haz.hairul@moh.gov.my
Received: 16 April 2022; Revised: 28 April 2023; Accepted: 30 April 2023; Published: 30 April 2023
Copyright: © 2023 Amran MHH. This is an open-access article distributed under the terms of the Creative Commons Attribution License, which permits unrestricted use, distribution, and reproduction in any medium, provided the original author and source are credited.
Citation: Amran MHHB (2023) Repeated administration effect of Superolein based intravenous lipid emulsion on lipid metabolism and liver metabolites of New Zealand White Rabbit, 21st Century Pathology, Volume 3 (2): 146
Abstract
Soy based intravenous lipid emulsion (ILE) may damage the endoplasmic and mitochondrial reticulum, resulting in lipid accumulation and pressure on the endoplasmic reticulum. The present study aimed to compare the effect of superolein oil-based ILE 20% and soy oil-based ILE 20% on lipid metabolism and liver metabolites in an animal model. Nine NZW rabbits were divided into three groups and infused with sodium chloride 0.9%, superolein-based ILE 20% and soy-based ILE 20% for 5 hours and repeated daily for three days. Blood samples were taken prior to ILE administration on day 1 until day 3, and the NZW rabbits were exsanguinated on day 4 to monitor plasma lipid and liver enzyme contents. Histological analysis was performed with hematoxylin and eosin, and O red oil staining. Supernatants from liver extraction were administered into a liquid-mass spectrometry system for metabolomic analysis. Plasma lipid and liver enzymes contents for all study groups did not differ from each other (p > 0.05). A total of 568 metabolites were identified and 60 metabolites related to hepatic disease were proven to have a significant difference (p < 0.05) between groups studied. These results suggest that the administration of SoLE 20% does not stimulate the occurrence of liver issues.
Keywords:
Intravenous lipid emulsion, Superolein oil, Medium Chain triglyceride, Liver metabolites, New Zealand white rabbit
Introduction
The administration of intravenous lipid emulsion (ILE) aims to prevent the development of essential fatty acids deficiency, as an alternative for body energy source, as a delivery vehicle for poorly water-soluble drugs and as an antidote in drug toxicities [1-4]. Although there are various ILEs available in the market, these products are soy oil-based. They carry the same risk to the liver as pure soy oil-based ILE. A study by Zhu X, et al. (2016) found that the administration of soy oil-based ILE can cause damage to the endoplasmic and mitochondrial reticulum, resulting in lipid accumulation and pressure on the endoplasmic reticulum [5]. Another study by Roche DL, et al. (2012) found that the administration of soy oil and medium chain triglyceride (MCT) oil mixture-based ILE, stimulates the occurrence of hyperlipidaemia and further promotes oxidative stress in Sprague-Dawley rats [6].
In clinical practice, the administration of ILE often results in liver complications such as lipid-overload syndrome [7-9]. Steatosis is the most common hepatic issue that occurs among adult patients receiving parenteral nutrition, while cholestasis is more common among children [10-12]. In addition to the monitoring of lipid metabolism in blood, metabolomics could be used for identifying or detecting associated metabolites in the liver and may also help reduce the risks associated with ILE administration. Previous studies have reported that fatty acids and amino acids metabolites were associated with the development of hepatic issues [13-15].
In addition, Ng KDO, et al. (2016) reported that α-tocopherol from vitamin E was able to provide protection against hepatic risk when administered together with ILE [16]. Natural tocopherols are abundant in palm olein oil and palm super olein oil (So) and are potential alternatives for soy oil-based ILE in the future. They also have antioxidant effects and can be beneficial in hypercholesterolemia [17]. The present study aimed to compare the effect of super olein oil-based ILE 20% (SoLE) and commercial soy oil-based ILE 20% (LiPO) on lipid metabolism and liver metabolites in an animal model.
Materials and Methods
Ethics Approval & Animals
This study was approved by Universiti Kebangsaan Malaysia Animal Ethics Committee with the approval number of FF/2017/AHMAD FUAD/24-MAY/847-JULY-2017-FEB.-2018. All procedures were done while the NZW rabbits were under anesthesia. Nine male NZW rabbits, weighing 2.22 ± 0.24 to 2.62 ± 0.36 kg were used in this study. The NZW rabbits were purchased from the Lab Animal Resource Unit, Faculty of Medicine, Universiti Kebangsaan Malaysia (LARU, UKM). The NZW rabbits were caged individually in the Animal Room, Faculty of Pharmacy, Universiti Kebangsaan Malaysia, for two weeks of acclimatization prior to the actual study. Weight, heart rate and respiratory rate were monitored on a daily basis, with free access to rabbit pellet and water throughout the acclimatization and study periods. The temperature and humidity of the room were set at 25°C and 55 ± 10% respectively, with a light-dark cycle for 12 hours each.
Preparation of SoLE 20%
Super olein oil (10 g), MCT oil (10 g) and lecithin (1.2 g) were mixed in a 500 ml beaker. Meanwhile, sodium oleate (20 mg), glycerol (2.5 g) and distilled water (80 g) were mixed in a 200 ml beaker. Both mixtures were incubated and stirred with a magnetic stirrer in a 70°C water bath for 10 minutes. Subsequently, both phases were mixed by adding the oil phase slowly into the constantly stirred aqueous phase. The mixture was then stirred continuously at 18000 rpm using an Ultra Turrax T25 Basic (IKA, German) for another 5 minutes to produce a coarse emulsion.
The coarse emulsion produced was further homogenized using an APV High Pressure Homogenizer 2000 (APV, Denmark) with a pressure of 800 psi for 7 cycles to produce a fine lipid emulsion. Then, the emulsion was transported to a grade B preparation room and the pH was adjusted with 1 M NaOH to pH 8.0 ± 0.5. The fine lipid emulsion was then transferred into 100 ml clear glass vials, purged with nitrogen gas for 5 minutes, closed with rubber stoppers and sealed with aluminium vial caps in the grade B production room. The ILE was sterilized using an autoclave at 121°C for 10 minutes.
Experimental design
A mixture of ketamine, Zoletil-50 and Xylazine (KTX) (LARU, UKM) were used as the anesthesia agent to restrain the rabbits. A dose of 0.2 ml/kg was administered as the first dose through the rabbit ear marginal blood vessels using a 1 ml syringe with a 30G x 4/8" injection needle (Terumo Corporation, Japan). Later, a dose of 0.1 ml/kg was supplied every 30-45 minutes as an additional dose [18].
The NZW rabbits were divided into three groups. The first group (n = 3) received sodium chloride 0.9% (NaCl 0.9%) as the negative control. The second group (n = 3) as the study group, received a 20% super olein-based intravenous lipid emulsion (SoLE). The third group (n = 3) received Lipofundin® 20% lipid emulsion (B. Braun Melsungen, Germany) (LiPO). Both SoLE and LiPO contained 10 g of super olein oil or 10 g of soy oil, 10 g of coconut oil, 2.5 g of glycerol, 1.2 g of lecithin, 20 g of sodium oleate and 100 g of distilled water.
SoLE 20%, LiPO 20% and NaCl 0.9% were infused for 5 hours/day for 3 days. The infusions were done through the marginal vein of the ear with silicon catheter; 23G size, 0.65 mm outer diameter, 19 mm long, Surflo® Winged Infusion Set (Terumo Corporation, Japan) connected to an Infusomat® Space P infusion pump (B. Braun Melsungen, Germany). Each group was tested with 1.0, 1.5, and 2.0 g/kg doses with 2 weeks of washout period for each dose.
Biochemical investigation
Blood samples of 10 ml were taken from the rabbit marginal ear artery using a 10 ml syringe connected to a 25Gx1" needle (Terumo Corporation, Japan) and inserted into EDTA-containing blood collection tubes. These blood collection tubes were stored at 4°C throughout the storage period. Blood samples were taken prior to the administration on day 1 and then were repeated on day 2 and day 3. Samples were also taken on day 4 to observe the effect of the third dose.
Biochemical analysis of NZW rabbit blood was performed to monitor the plasma lipid content including: cholesterol (CHOL), low density lipoprotein (LDL), high density lipoprotein (HDL), triglyceride (TG) and free fatty acids (FFA). The liver enzyme profile was also analyzed for: alanine aminotransferase (ALT), alkaline phosphatase (ALP), aspartate aminotransferase (AST), albumin and bilirubin [19,20]. Sample analysis was performed using the ADVIA 2400 machine (Siemens Healthineers GmbH, Germany) within 24 hours of blood sample collection.
Euthanasia & Necropsy of the NZW rabbit
The euthanasia method for the NZW rabbits in this study was by exsanguination. The rabbits were anesthetized with 0.2 ml/kg KTX prior to exsanguination. Necropsy was performed after the confirmation of the death of the rabbit and the liver was taken out in preparation for histology and metabolomic studies. The weighted liver was placed in a light-shielded container and stored in a -80°C freezer [21].
Histological examination
Hepatic samples from proximal and distal sections were cut into 10 mm length x 10 mm width x 5 mm thick pieces and placed on the sample site on a Cryostat HM525 Nx microtome (Thermo Fisher Scientific, German). The NEG 50™ embedded medium (Richard-Allan Scientific, USA) was poured onto the samples and left to freeze. The samples were cut and trimmed to 4 μm thickness using the microtome at -25°C. Hepatic samples were placed on the 25 x 75 x 1.0 mm Polysine® Menzel-Glaser microscope slides (Thermo Fisher Scientific, German) and stained with O red oil (ORO).
Samples for hematoxyl and eosin (H&E) staining were fixed in a 10% formalin preparation for 48 hours. Then samples were placed into plastic cassettes, dehydrated and immersed in paraffin wax. Once dried, the samples were cut and trimmed to 4 μm thickness using the microtome. Samples were placed on 26 x 76 x 1.0 mm microscope slides (AGS, China). Sample slides with H&E and ORO staining were viewed using an Olympus BX40 microscope (Olympus Optical Co. Ltd., Japan) for histological analysis. Sample images were viewed and analysed at x40 magnification.
Metabolomics analysis
Extraction of lipid from NZW rabbit livers was performed based on the methods [22]. Briefly, 400 μl of deionized water was inserted into a microcentrifuge tube containing 30 mg of NZW rabbit liver tissue and the content was homogenized. About 1 ml of chloroform, methanol and water mixture (2:1:1) were added to the microcentrifuge tube. Then, the sample was vortexed at 12000 xg for 10 minutes. The supernatant solution was taken and prepared for metabolic analysis. A total of 5 μl of sample mixture was included in the quartet and closed. Three replicates were provided for each sample and were administered into a liquid-mass spectrometry system for metabolomics analysis.
Metabolomics analysis was performed using the Dionex UltiMate 3000 UHPLC fluid chromatography system (Thermo Scientific, USA) with Bruker Daltonic MicroTOF QIII (Bruker Corporation, Germany) mass spectrometer. Separation of liquid chromatography samples was carried out using an Acclaim C18 column (3 mm x 150 mm, 2.6 μm) (Thermo Scientific, USA). The elution was carried out at 0.4 ml/min and 40°C, using a H2O mixture and 0.1% formic acid (A) and 100% ACN (B) as the mobile phase with a total operating time of 22 minutes. The sample volume was 1 μl. The gradient started with 5% B (0-3 min); 80% B (3-10 min); 80% B (10-15 min) and 5% B (15-22 min). The exact data for the mass of the ionic molecules supplied by TOF analyzers were processed by the Compass Data Analysis software (Bruker Daltonik GmbH, Germany) [23].
The metabolite identification, molecular formula and group determination were based on the KEGG database at https://www.genome.jp/kegg/, HMDB's website at http://www.hmdb.ca/, PubChem at https://pubchem.ncbi.nlm.nih.gov/, LipidMaps on https://www.lipidmaps.org/ and previous research reports [14,24].
Statistical analysis
Statistical analysis was performed using GraphPad Prism® software version 5 (GraphPad Software Inc., USA) and IBM SPSS Statistic® (IBM Corporation, USA) software. Comparison of statistical data for three groups or more, and one way ANOVA method were used. Before the statistical analysis was done, the data distribution was identified first. The data distribution patterns of the three groups were reviewed using the Barlett test. The value of p < 0.05 was considered to have a significant difference. Data were reported as mean and standard deviation.
Results
All of the rabbits survived the intravenous administration of 1.0-2.0 g/kg SoLE 20% for five hours a day for 3 days without complications. Throughout the acclimatization and study periods, the weight (2.22 ± 0.24 to 2.62 ± 0.36 kg), rectal temperature (36.32 ± 0.51 to 40.32 ± 0.25°C), heart rate (108.44 ± 6.01 to 158.22 ± 8.57 counts/min) and respiratory rate (37.33 to 56.00 counts/min) were within acceptable ranges.
Biochemical investigation
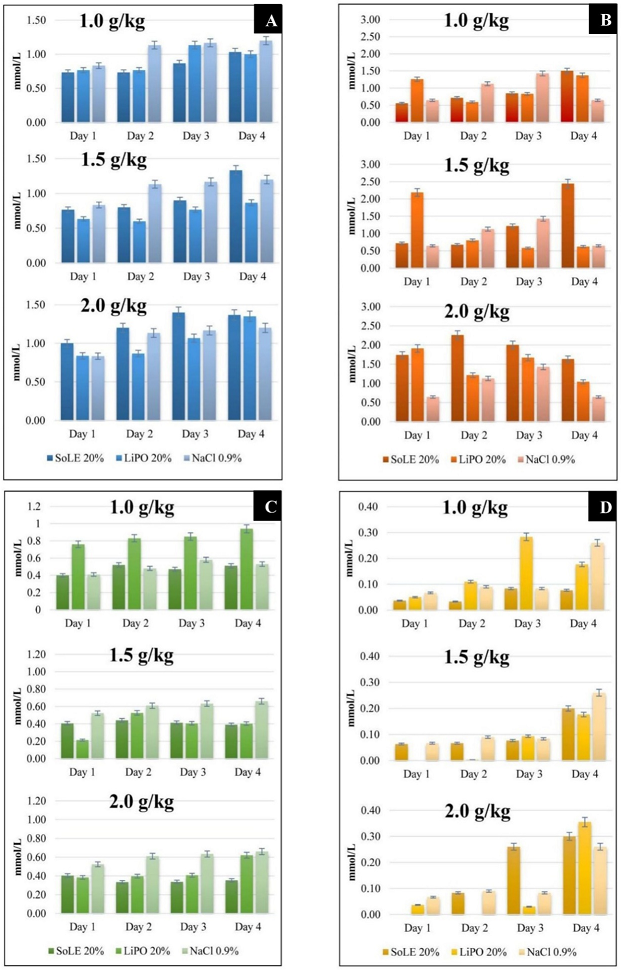
Figure 1: Comparison of NZW rabbit blood lipid profile between groups at different ILE doses. (A) Cholesterol, (B) Triglyceride, (C) HDL and (D) LDL. Data were presented as mean ± SD with statistical analysis using one way ANOVA and p < 0.05 considered as statistically significant.
Lynch syndrome (LS) is defined by the presence of a germline pathogenic variant in one of the DNA mismatch repair genes MLH1, MSH2, MSH6, or PMS2. Patients with LS have an increased rate of colorectal and multiple extracolonic malignancies with the risks varying according to the variant and gender (Table 3) [21]. MLH1 and MSH2 mutations have a higher incidence of CRC. The exact penetrance of PMS2 variants as a causative factor for cancer remains debated and continues to be defined. Overall, LS accounts for 3% of colorectal cancer cases, and among LS patients, 20-30% will develop rectal cancer [3,16].
Table 3: Colorectal Cancer Incidence by Age and Mutation.
The animal studies conducted showed that the blood cholesterol content for SoLE 20%, LiPO 20% and NaCl 0.9% did not differ for the three doses of 1.0, 1.5 and 2.0 g/kg (p > 0.05). The cholesterol content was in the range of 0.60 mmol/L to 1.40 mmol/L. In the case of blood triglyceride, there was no significant difference between the three doses of 1.0, 1.5 and 2.0 g/kg (p > 0.05). Comparison between groups found that there was a difference in the triglyceride value of the first day of the dosage of 1.5 g/kg (p < 0.05). However, rabbit blood was taken before the administration of parenteral lipid emulsion. Therefore, the LiPO 20% group triglyceride level was definitely not due to its administration.
Measurement of the HDL and LDL content in the blood for each group with different doses also showed that the contents did not differ from each other (p > 0.05). The HDL content of rabbit blood ranged from 0.33 to 0.66 mmol/L. The LDL content is in the range of 0.00 to 0.36 mmol/L. Figure 1 (A), (B), (C) and (D) shows the NZW rabbit lipid profiles in this study and the comparison of between SoLE 20%, LiPO 20% and NaCl 0.9%.
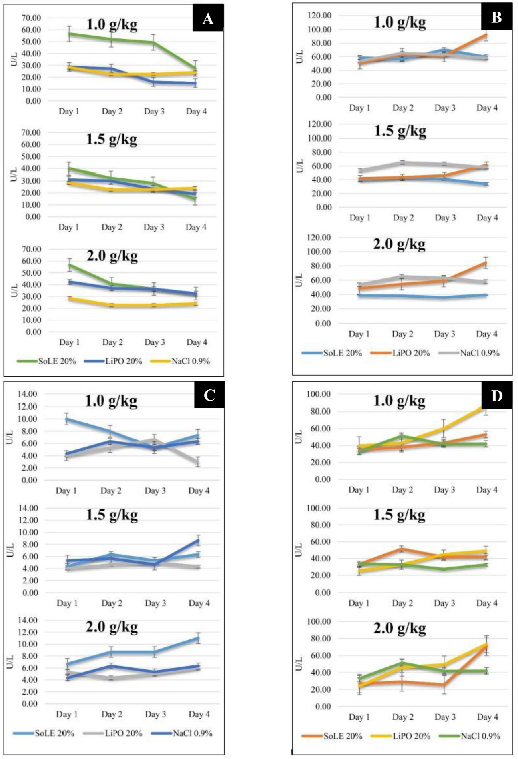
Figure 2: Comparisons of NZW rabbit blood lipid profile between groups at different ILE doses. (A) ALP, (B) ALT, (C) GGT and (D) AST. Data were presented as mean ± SD with statistical analysis using one way ANOVA and p < 0.05 considered as statistically significant.
The study also investigated the effects of ILE administration on the liver enzyme profile of the NZW rabbits. The level of ALP for SoLE 20%, LiPO 20% and NaCl 0.9% did not differ from each other for the three doses studied. Only the dose of 1.0 g/kg resulted in a difference in the second and third day (p = 0.0407, p = 0.0281). The ALP level was decreased for both SoLE 20% and LiPO 20% groups for the three doses studied. The study showed that the ALP level ranged from 15.00 to 56.67 U/L.
Measurement of the ALT found that the supply of SoLE 20%, LiPO 20% and NaCl 0.9% did not lead to changes in its level during the study period (p > 0.05). However, the ALT level was increased in the LiPO 20% group for the three doses studied. This increment was not observed in the SoLE 20% and NaCl 0.9% groups. In addition, the LiPO 20% group had the highest ALT on day 4 for each dose studied compared to SoLE 20% and NaCl 0.9%. However, the statistical test only showed the difference in the 1.0 g/kg dose (p = 0.0199). The ALT levels measured were in the range of 15.00 to 56.67 U/L.
Measurement of the GGT levels found no significant difference between the study groups (p > 0.05). The only difference was seen on the fourth day for the 1.0 g/kg dose, where SoLE 20% produced the highest GGT level (p = 0.0464). The administration of ILE has not been performed prior to the first blood intake. Therefore, the difference between the groups was not caused by the administration of 1.0 g/kg of ILE. Generally, the NZW rabbit blood GGT levels were between 4.33 and 11.00 U/L.
Measurement of the AST also found that there was no significant difference on AST levels between groups at different doses (p > 0.05). The AST levels ranged from 33.00 to 86.67 mmol/L. The results showed a consistent increase in the AST level of the LiPO 20% group for the three doses studied but this was not statistically significant (p = 0.1799, p = 0.1535, p = 0.3456) (Figure 2).
The bilirubin and albumin contents did not differ among the tested doses or between the study groups. The total value of bilirubin was lower than 2 μmol/L, even when there was an increase in dosage for each group studied.
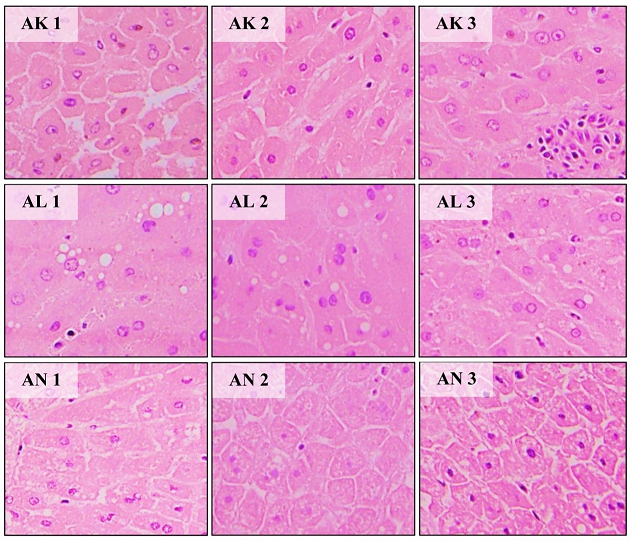
Figure 3: Histologic examination of male NZW rabbit liver cell with H&E. (AK1-AK3) hepatocyte of NaCl 0.9% group (control), (AL1-AL3) hepatocytes of LiPO 20% group, (AN1-AN4) hepatocytes of SoLE 20% group.
Histological examination
Using H&E staining, hepatocyte cells were stained pink with blue-purple nucleus. Hepatocytes and liver sinusoids can also be seen and identified. Hepatocytes from the SoLE 20% group samples looked similar to the control group cells. However, cell expansion with swollen cytoplasm was observed in hepatocytes from the LiPO 20% group. The sinusoid also appeared to be less clear and colourless bubbles were also identified. Through the ORO staining method, the bubbles were confirmed to be lipids [22-28]. Figure 3 shows the visual appearance of the NZW rabbit liver cells.
Metabolomics analysis
A total of 568 metabolites have been identified through the metabolomics analysis of NZW rabbit hepatocytes with 241 metabolites proven to have a significant difference (p < 0.05). A total of 8 metabolites of fatty acids, 16 metabolites of amino acids and 8 other derived putative metabolites have been identified. Tables 1, 2, and 3 list the metabolites together with related information such as actual mass and molecular formulae of the metabolites.
Table 1: Fatty acids derivative metabolites (putative).
|
Mass (m/z) |
Metabolite |
Molecule formula |
|
|
Metabolite |
Reference |
||
|
207.049 |
208.0592 |
Lipoic acid |
C8H16O2S2 |
|
209.057 |
174.0892 |
Suberic acid |
C8H14O4 |
|
247.126 |
247.1056 |
Malonylcarnitine |
C10H17NO6 |
|
323.214 |
300.230 |
Heptadecanedioic acid |
C17H32O4 |
|
335.071 |
334.2872 |
Docosatrienoic acid |
C22H38O2 |
|
357.276 |
356.2715 |
Tetracosahexaenoic acid |
C24H36O2 |
|
371.224 |
348.2301 |
Methyl 6-hydroperoxy-4,8,11,14,17-eicosapentanoic acid |
C21H32O4 |
|
631.346 |
596.3689 |
L-phosphatidic acid |
C29H57O10P |
Table 2: Amino acids derivative metabolites (putative).
|
Mass (m/z) |
Metabolite |
Molecule formula |
|
|
Metabolite |
Reference |
||
|
106.051 |
105.0426 |
Serine |
C3H7NO3 |
|
116.071 |
115.0633 |
Proline |
C5H9NO2 |
|
118.087 |
117.0790 |
Valine |
C5H11NO2 |
|
120.066 |
119.0582 |
Threonine |
C4H9NO3 |
|
122.028 |
121.0197 |
Cysteine |
C3H7NO2S |
|
130.050 |
129.0426 |
Pyroglutamic acid |
C5H7NO3 |
|
132.102 |
131.0946 |
Isoleucine |
C6H13NO2 |
|
134.030 |
135.0354 |
Homocysteine |
C4H9NO2S |
|
147.113 |
146.1055 |
Lysine |
C6H14N2O2 |
|
148.043 |
149.051 |
Methionine |
C5H11NO2S |
|
148.060 |
147.0532 |
Glutamic acid |
C5H9NO4 |
|
166.085 |
165.0790 |
Phenylalanine |
C9H11NO2 |
|
182.080 |
181.0739 |
Tyrosine |
C9H11NO3 |
|
205.095 |
204.0899 |
Tryptophan |
C11H12N2O2 |
|
245.112 |
246.1216 |
γ-glutamyl-valine |
C10H18N2O5 |
|
258.146 |
259.1532 |
γ-glutamyl-leucine |
C11H21N3O4 |
Table 3: Others derivative metabolites (putative).
|
Mass (m/z) |
Metabolite |
Molecule formula |
|
|
Metabolite |
Reference |
||
|
104.108 |
103.0997 |
Choline |
C5H13NO |
|
173.019 |
172.0137 |
Glycerol-3-phosphate |
C3H9O6P |
|
179.054 |
180.0634 |
Glucose |
C6H12O6 |
|
204.965 |
169.998 |
Glyceraldehyde-3-phosphate |
C3H7O6P |
|
216.061 |
215.0559 |
Glycerophosphorylethanolamine |
C5H14NO6P |
|
258.108 |
257.1028 |
Glycerophosphocholine |
C8H20NO6P |
|
261.035 |
260.0297 |
Glucosa-6-phosphate |
C6H13O9P |
|
667.225 |
666.2219 |
Glycogen |
C24H42O21 |
Discussion
Lipid profile contents
Blood total cholesterol (TC) is usually affected by exogenous sources such as ILE and endogenous sources through de novo synthesis. The present study has found that the TC content ranged from 0.60 ± 0.20 to 1.40 ± 0.53 mmol/L. The administration of SoLE 20% and LiPO 20% did not increase the TC content compared to the control group (p > 0.05). The normal blood TC for NZW rabbit is 0.99-2.05 mmol/L [29-31]. High TC content in the blood will produces hypercholesterolemia and increase the risk for atherosclerosis [32].
TG in ILE serves as the major source of non-protein calories [33]. The TG content of NZW rabbits in the current study ranged from 0.46 ± 0.18 to 2.44 ± 2.00 mmol/L. The normal blood TG content for NZW rabbit is 0.82-1.51 mmol/L [28-30]. Even though the TG contents of the studied groups were similar (p > 0.05), the blood TG content for the SoLE 20% group was higher compared to the LiPO 20% and control groups after the third dose. High TG content in blood will stimulate cholesterol synthesis activity [29,34]. However, the high TG content seen in the present study was inconsistent with the increase in the dose and supply duration of 2.0 g/kg SoLE 20%. This may also be affected by triglyceride metabolism [35]. This issue was also reported by Cai W, et al. (2018), where the supply of TG may increase blood TG content above normal values [12].
HDL and LDL act as cholesterol carriers in the circulatory system. In the present study, the blood HDL content ranged from 0.33 ± 0.16 to 0.66 ± 0.24 mmol/L. The LDL content was between 0.00 to 0.36 ± 0.08 mmol/L. The normal HDL content for NZW rabbits is 0.45-0.76 mmol/L, while the normal LDL content is 0.18-0.52 mmol/L [29-31]. Measurement of the HDL and LDL contents in the blood for each dosage group also found that the contents did not differ from each other (p > 0.05). LDL plays an important role in transporting cholesterol and the risk of producing fat plaques in the bloodstream is higher with increased LDL content. On the other hand, HDL transports cholesterol to the liver for metabolism or excretion [36]. The present study found that the HDL and LDL contents were not increased because the supplied ILE does not contain cholesterol. This observation showed that the risk of atherosclerosis incidence is low for repeat administration of SoLE 20%.
Liver enzymes profile contents
Most ALP is present in hepatocytes near to the bile duct. As a result, the ALP level will increase during biliary stasis [37]. The ALP level of the NZW rabbits ranged from 15.00 ± 12.49 to 56.67 ± 27.43 U/L. The normal blood ALP level for NZW rabbits is 12.00-96.00 U/L [38]. Despite the decrease of ALP level during the study periods for both SoLE 20% and LiPO 20% groups, they were still in the acceptable range. Lower ALP levels might be related to the supply of ILE without magnesium and zinc supplementation [39].
The ALT enzyme is contained in many tissues and is not a good hepatic enzyme marker due to its five hours life duration. Blood ALT levels for rabbits in current study ranged from 34.00 ± 9.90 to 92.33 ± 6.66 U/L. The normal ALT level for NZW rabbits is 55.00-260.00 U/L [38]. An increased level may be associated with inflammation and necrosis of liver cells [26,36,39]. Although there was an increase in the ALT level in the LiPO 20% group, it was still within the normal range. The same observation was also reported by Onyesom I, et al. (2007) [40].
Even though the GGT enzyme is present in the liver and kidneys, the blood GGT is derived from the liver. Therefore, it is a good hepatic enzyme marker for liver-related general issues such as liver cell damage and bile acid stasis [37,38]. Generally, the level of NZW rabbit blood GGT in this study ranged from 4.33 ± 1.15 to 11.00 ± 3.61 U/L. The normal GGT content for NZW rabbits is 0.00-31.00 U/L [38,41,42]. Although the GGT value in current study was inconsistent, it was still within the normal range.
In addition to liver and skeletal muscles, AST is also present in the heart, kidneys and pancreas. The blood AST level of the current study was in the range of 24.00 ± 2.00 to 86.67 ± 43.39 U/L. The normal AST level for NZW rabbits is 33.00-99.00 U/L [38]. As the AST level was within the acceptable range, this suggested the non-occurrence of necrosis in liver cells [27,37,38,40]. A low AST level was also reported by Onyesom I, et al. (2007) in their study [40].
Histology study
The administration of SoLE 20% to NZW rabbits repeatedly for three days did not change the structure and condition of hepatocytes cells. On the other hand, the administration of LiPO 20% has led to the occurrence of lipids in the hepatocytes. An accumulation of lipid or fat in hepatocytes will lead to steatosis [43]. A similar finding was observed and reported by Zhu X, et al. (2015). In their study, 7-days-old NZW rabbits administered with 7 days of parenteral nutrition containing soybean oil and MCT oil also resulted in steatosis [44].
Liver disease related metabolites
Hyperlipidaemia is closely related to energy, amino acids and lipid metabolism. It is detected by the increase in the content of betaine metabolites and cholesterol in the serum cholesterol model. If the hyperlipidaemia situation is prolonged, it will stimulate the occurrence of steatosis [15].
Through this study, glycerophosphorilethanolamine and glycerophosphorylcholine in the rabbit liver of the group receiving LiPO and SoLE were increased compared to the control group. The contents of the SoLE group were higher than in the LiPO group (p < 0.05). However, the choline content did not show an increase between the LiPO and SoLE groups compared to the NS group. An earlier study reported that glycerophosphocholine, glycerophosphoethanolamine, glycerophosphoinositol, glycerophosphoglycerol, lysoglycerophosphocholine and ceramide contents in plasma are increased in non-alcoholic steatohepatitis, while phosphatidylcholine and phosphatidylethanolamine contents are reduced in steatosis patients [14]. This suggested that the SoLE group was not at risk of steatosis if the supply of lipid emulsions persists.
Furthermore, some saturated fatty acids and polyunsaturated fatty acids were also identified. The amounts were small and have no significant difference between the groups studied (p > 0.05). Among the saturated fatty acids metabolites identified were heptadecanodioic acid and lipoic acid. The identified polyunsaturated fatty acids metabolites were docosatrienoic, tetracohexanoic acid and suberic acid. The reduction of these metabolites contents as well as increased monounsaturated fatty acids contents have been reported among non-alcoholic fatty liver disease patients [14,43].
In the current study, we also found that isoleucine, tryptophan and serine contents were not different between the groups studied (p > 0.05). Jin R, et al. (2016) reported the occurrence of uncertainty in the content of branch chain amino acids metabolites such as valine, leucine, isoleucine, tryptophan, glycine, serine, alanine and threonine among patients with steatosis in their study [45]. This suggested that the liver sample of the group studied did not show any occurrence of steatosis.
In the current study, tyrosine was present in all study groups with no significant difference in the amount (p > 0.05). As the major precursor for catecholamine, this finding proved that there was no increase in the production of catecholamine products in all of the study groups. Previous studies have reported that tyrosine metabolism has the most influence on the metabolite pathway in NAFLD and is associated with the risk of hyperlipidaemia and steatosis [15,46]. This study also identified the presence of phenylalanine and homocysteine metabolites which are also precursors for catecholamine. Phenylalanine contents were also the same in all study groups (p > 0.05), while homocysteine contents were different between the studied groups.
Triacylglycerol synthesis related metabolites
Accumulation of triacylglycerol (TAG) is an important feature for the formation of steatosis in liver cells through its interference in lipid metabolism [47,48]. The study found that the SoLE group had elevated glyceraldehyde-3-phosphate, glucose and glycogen contents compared to the NS group and LiPO (p < 0.05). Meanwhile, the content of glycerol-3-phosphate, glucose-6-phosphate and phosphatidic acid did not differ between the studied groups. Through this observation, it is clear that TAG production did not increase without the accumulation of glycerol-3-phosphate.
Even though the glyceraldehyde-3-phosphate content was increased, it was also involved in the production of pyruvate for the tricarboxylic acid cycle. This observation was supported by the identification of malonylcarnitine metabolites. The malonylcarnitine regulation usually gives a description of malonyl-CoA levels, an important metabolite in the production of fatty acids [48]. The current study found that the malonylcarnitine content was no different among the three groups studied. This situation suggests that no synthesis of fatty acids and triglycerides occurred following the supply of eicosapentaenoic acid found in the SoLE and LiPO lipid emulsions. Generally, it is known that the eicosapentaenoic acid supply will inhibit the lipogenesis process [48].
This study also detected phosphatidic acid, the simplest phospholipid that has a major role in the synthesis of glycerophospholipids. Phosphatidic acid also acts as the lipid membrane and supplier for the negative charge to the anionic membrane structure [49,50]. There was no difference between the phosphatidic acid content in all of the studied groups (p > 0.05). This could be due to its content being controlled by the lipid phosphate enzyme to remain at a low level by converting phosphatidic acid to diacylglycerol. Diacylglycerol is also a precursor to many other lipids [50].
Oxidative stress related metabolites
Glutathione metabolism is the ultimate endogenous defence system against cellular oxidative stress. Glutathione protection includes reduction of hydroperoxide content, free radical feasibility and xenobiotic detoxification [15,51,52]. The current study detected five metabolites involved in glutathione metabolism, namely: piroglutamic acid, γ-glutamyl-valine, γ-glutamyl-leucine, cysteine and glutamic acid. All of these metabolites have the same contents between study groups (p > 0.05). Kalish BT, et al. (2013) reported that pyroglutamic acid, γ-glutamylvaline, γ-glutamyl glutamic, γ-glutamyl phenylalanine and γ-glutamiltreonina were among the metabolites that can be identified as precursors to glutathione [48].
A study by Sun et al. (2017) reported that mice undergoing pathogenesis of hyperlipidemia were likely to experience oxidative stress, which in turn leads to fatty liver disease [15]. The lysine content in the hyperlipidemia mice serum was low compared to control. In current study, lysine was identified in SoLE and LiPO group samples but was not present in the NS group samples. Both LiPO and SoLE samples had different contents and the content in SoLE exceeded its content in LiPO (p < 0.001). This suggested that the supply of SoLE can reduce the risk for the occurrence of hyperlipidemia.
Our study found that the methionine content in the groups studied were different, with SoLE having the highest content, followed by LiPO and NS (p < 0.05). Methionine is an intermediary molecule in homocysteine production. Betaine acts as a methyl group donor during the homocysteine conversion to methionine and subsequently maintains the S-adenosine content of methionine [15]. The finding of the current study suggested that the administration of SoLE 20% will increase homocysteine production and reduce the risk of hyperlipidemia. The study conducted by Kusku-Kiraz Z, et al. (2018) on guinea pigs found that the group supplied with a mixture of cholesterol, methionine and betaine had lower homocysteine and lipid content than those receiving cholesterol and methionine, and cholesterol. In fact, the histopathological lesions were also reversed and recovered [53].
Conclusion
Our animal study has shown that the administration of SoLE 20% repeatedly for 3 days did not alter lipid profile and liver enzyme profile. This proves that SoLE 20% has a huge potential as an alternative ILE in the future with a lower risk to the liver. The effect of SoLE 20% on liver metabolites status was seen through three categories, namely: metabolites related to hepatic diseases, metabolites related to triacylglycerol and metabolites related to oxidative stress. Thus, it can be concluded that the detected metabolites such as choline, valine, leucine, isoleucine, glycerol-3-phosphate, phosphatic acid, pyroglutamic acid, γ-glutamyl, lysine and methionine showed that the supply of SoLE 20% does not promote the production of triacylglycerol, excessive fatty acids or oxidative stress on hepatocytes.
Therefore, it is clear that this study proves the supply of SoLE does not increase the risk of hepatic disease such as steatosis. Our results suggest that the supply of SoLE 20% does not stimulate the occurrence of hypercholesterolemia, hypertriglyceride, hyperglycemia, steatosis and cholestasis. The histological study by H&E and ORO staining also confirmed that the hepatocyte cells of the SoLE 20% group were in good condition.
Acknowledgements
We would like to thank the Director General of Health Malaysia for his permission to publish this article. This work has been supported by Universiti Kebangsaan Malaysia and the super olein oil has been supplied by FELDA IFFCO Sdn. Bhd. (Klang, Malaysia).
Ethical Statement
Compliance with ethical standards
Conflict of Interest
The authors declare that they have no conflict of interest.
References
1. Vanek VW, Seidner DL, Allen P, Bistrian B, Collier S, Gura K, Miles JM, Valentine CJ, Kochevar M. Novel nutrient task force, intravenous fat emulsions workgroup. American Society for Parenteral and Enteral Nutrition (ASPEN) Board of Directors. ASPEN position paper: clinical role for alternative intravenous fat emulsions. Nutr Clin Pract. 2012 Apr;27(2):150-92. https://doi.org/10.1177/0884533612439896
2. Akbari H, Dalir-Naghadeh B. The effects of short term intravenous infusion of a soybean based lipid emulsion on some blood constituents in sheep: A preliminary study. InVeterinary Research Forum: an International Quarterly Journal 2014 (Vol. 5, No. 1, p. 35). Faculty of Veterinary Medicine, Urmia University, Urmia, Iran.
3. Driscoll DF. Commercial Lipid Emulsions and All-in-One Mixtures for Intravenous Infusion-Composition and Physicochemical Properties. Intravenous lipid emulsions. 2015;112:48-56. https://doi.org/10.1159/000365430
4. Fettiplace MR, Weinberg G. Past, present, and future of lipid resuscitation therapy. Journal of Parenteral and Enteral Nutrition. 2015 Sep;39:72S-83S. https://doi.org/10.1177/0148607115595979
5. Zhu X, Xiao Z, Xu Y, Zhao X, Cheng P, Cui N, Cui M, Li J, Zhu X. Differential impacts of soybean and fish oils on hepatocyte lipid droplet accumulation and endoplasmic reticulum stress in primary rabbit hepatocytes. Gastroenterology Research and Practice. 2016 Jan 5;2016. https://doi.org/10.1155/2016/9717014
6. DelgadoRoche L, FragaPerez Á, BequerViart MA, Hernández-Matos Y. Lipofundin 20% induces hyperlipidemia and oxidative stress in male Sprague Dawley rats. Veterinary World. 2012 Mar 1;5(3):133-37. https://doi.org/10.5455/vetworld.2012.133-137
7. Lipids. Journal of Pediatric Gastroenterology and Nutrition 41:p S19-S27, November 2005. https://doi.org/10.1097/01.mpg.0000181844.08876.7c
8. Adolph M, Heller AR, Koch T, Koletzko B, Kreymann KG, Krohn K, Pscheidl E, Senkal M, Working group for developing the guidelines for parenteral nutrition of The German Association for Nutritional Medicine. Lipid emulsions–guidelines on parenteral nutrition, chapter 6. GMS German Medical Science. 2009;7. https://doi.org/10.3205/000081
9. Bolisetty S, Osborn D, Sinn J, Lui K, Australasian Neonatal Parenteral Nutrition Consensus Group. Standardised neonatal parenteral nutrition formulations–an Australasian group consensus 2012. BMC pediatrics. 2014 Dec;14:1-1. https://doi.org/10.1186/1471-2431-14-48
10. Hojsak I, Colomb V, Braegger C, Bronsky J, Campoy C, Domellöf M, Embleton N, Mis NF, Hulst JM, Indrio F, Lapillonne A. ESPGHAN Committee on Nutrition Position Paper. Intravenous lipid emulsions and risk of hepatotoxicity in infants and children: a systematic review and meta-analysis. Journal of pediatric gastroenterology and nutrition. 2016 May 1;62(5):776-92. https://doi.org/10.1097/MPG.0000000000001121
11. Donoghue V, Spruyt M, Blaauw R. Use of intravenous fat emulsions in adult critically ill patients: does omega 3 make a difference? South African Journal of Clinical Nutrition. 2017;30(3).
12. Cai W, Calder PC, Cury-Boaventura MF, De Waele E, Jakubowski J, Zaloga G. Biological and clinical aspects of an olive oil-based lipid emulsion—A review. Nutrients. 2018 Jun 15;10(6):776. https://doi.org/10.3390/nu10060776
13. Schlemmer HP, Sawatzki T, Sammet S, Dornacher I, Bachert P, Van Kaick G, Waldherr R, Seitz HK. Hepatic phospholipids in alcoholic liver disease assessed by proton-decoupled 31P magnetic resonance spectroscopy. Journal of hepatology. 2005 May 1;42(5):752-9. https://doi.org/10.1016/j.jhep.2004.12.032
14. Papandreou C, Bullò M, Tinahones FJ, Martínez-González MÁ, Corella D, Fragkiadakis GA, López-Miranda J, Estruch R, Fitó M, Salas-Salvadó J. Serum metabolites in non-alcoholic fatty-liver disease development or reversion; a targeted metabolomic approach within the PREDIMED trial. Nutrition & metabolism. 2017 Dec;14(1):1-1. https://doi.org/10.1186/s12986-017-0213-3
15. Sun JH, Liu X, Cong LX, Li H, Zhang CY, Chen JG, Wang CM. Metabolomics study of the therapeutic mechanism of Schisandra Chinensis lignans in diet-induced hyperlipidemia mice. Lipids in Health and Disease. 2017 Dec;16(1):1-4. https://doi.org/10.1186/s12944-017-0533-3
16. Ng K, Stoll B, Chacko S, Saenz de Pipaon M, Lauridsen C, Gray M, Squires EJ, Marini J, Zamora IJ, Olutoye OO, Burrin DG. Vitamin E in new?generation lipid emulsions protects against parenteral nutrition–associated liver disease in parenteral nutrition–fed preterm pigs. Journal of Parenteral and Enteral Nutrition. 2016 Jul;40(5):656-71. https://doi.org/10.1177/0148607114567900
17. Narang D, Sood S, Thomas MK, Dinda AK, Maulik SK. Effect of dietary palm olein oil on oxidative stress associated with ischemic-reperfusion injury in isolated rat heart. BMC pharmacology. 2004 Dec;4:1-0. https://doi.org/10.1186/1471-2210-4-29
18. Cheong LK. Introduction to Techniques of Intravenous Inoculation and Anaesthesia in Rodents and Rabbit: An Illusration of Simple and Efficient Approaches. Universiti Kebangsaan Malaysia; 2015.
19. Garavelo SM, Higuchi MD, Pereira JJ, Reis MM, Kawakami JT, Ikegami RN, Palomino SA, Wadt NS, Agouni A. Comparison of the protective effects of individual components of particulated trans-sialidase (PTCTS), PTC and TS, against high cholesterol diet-induced atherosclerosis in rabbits. BioMed Research International. 2017 Feb 27;2017. https://doi.org/10.1155/2017/7212985
20. Zhao DW, Tian M, Yang JZ, Du P, Bi J, Zhu X, Li T. Hemostatic mechanism underlying microbubble-enhanced non-focused ultrasound in the treatment of a rabbit liver trauma model. Experimental Biology and Medicine. 2017 Jan;242(2):231-40. https://doi.org/10.1177/1535370216669835
21. Trebušak T, Levart A, Franki? T, Pirman T. Effect of dietary linseed oil and Ganoderma lucidum or olive leaves supplementation on fatty acid composition and oxidative status of rabbits. World Rabbit Science. 2014 Mar 28;22(1):71-81. https://doi.org/10.4995/wrs.2014.1183
22. Hall Z, Bond NJ, Ashmore T, Sanders F, Ament Z, Wang X, Murray AJ, Bellafante E, Virtue S, Vidal?Puig A, Allison M. Lipid zonation and phospholipid remodeling in nonalcoholic fatty liver disease. Hepatology. 2017 Apr;65(4):1165-80. https://doi.org/10.1002/hep.28953
23. Goh HH, Khairudin K, Sukiran NA, Normah MN, Baharum SN. Metabolite profiling reveals temperature effects on the VOC s and flavonoids of different plant populations. Plant Biology. 2016 Jan 2;18:130-9. https://doi.org/10.1111/plb.12403
24. Liu XL, Ming YN, Zhang JY, Chen XY, Zeng MD, Mao YM. Gene-metabolite network analysis in different nonalcoholic fatty liver disease phenotypes. Experimental & molecular medicine. 2017 Jan;49(1):e283. https://doi.org/10.1038/emm.2016.123
25. Kohl M, Wedel T, Entenmann A, Stuttmann J, Bendiks M, Loff S, Köster S, Ortfeld S, Bos I. Influence of different intravenous lipid emulsions on hepatobiliary dysfunction in a rabbit model. Journal of pediatric gastroenterology and nutrition. 2007 Feb 1;44(2):237-44. https://doi.org/10.1097/01.mpg.0000252193.99331.03
26. Carlson SJ, Nandivada P, Chang MI, Mitchell PD, O’Loughlin A, Cowan E, Gura KM, Nose V, Bistrian BR, Puder M. The addition of medium-chain triglycerides to a purified fish oil-based diet alters inflammatory profiles in mice. Metabolism. 2015 Feb 1;64(2):274-82. https://doi.org/10.1016/j.metabol.2014.10.005
27. Mayada RF, Taghred MS, Haytham AA. Boldenone-induced apoptotic, structural, and functional alterations in the liver of rabbits. World Rabbit Science. 2015 Mar 25;23(1):39-46.
28. Zhu X, Zhang X, Yu L, Xu Y, Feng X, Wang J. Hepatic overexpression of GRP94 in a rabbit model of parenteral nutrition-associated liver disease. Gastroenterology Research and Practice. 2015 Mar 30;2015. https://doi.org/10.1155/2015/269831
29. Delgado Roche L, Acosta Medina E, Fraga Pérez Á, Bécquer Viart MA, Soto López Y, Falcón Cama V, Vázquez López AM, Martínez-Sánchez G, Fernández-Sánchez E. Lipofundin-induced hyperlipidemia promotes oxidative stress and atherosclerotic lesions in New Zealand white rabbits. International Journal of Vascular Medicine. 2012;2012. https://doi.org/10.1155/2012/898769
30. Delgado R L, Fraga P Á, Bécquer V M, Vázquez L A. Lipofundin 20% induces hepatic lipid peroxidation in New Zealand white rabbits. Revista MVZ Córdoba. 2012 Sep;17(3):3113-7. https://doi.org/10.21897/rmvz.209
31. Shahid U, Khan DA, Noor U, Butt SA. Effect of tocotrienols on lipid profile in rabbits. Journal of Rawalpindi Medical College. 2012 Jun 30;16(1):68-69.
32. Berdanier CD, Berdanier LA, Zempleni J. Advanced nutrition: macronutrients, micronutrients, and metabolism. CRC press; 2008 Aug 6.
33. Raman M, Almutairdi A, Mulesa L, Alberda C, Beattie C, Gramlich L. Parenteral nutrition and lipids. Nutrients. 2017 Apr 14;9(4):388. https://doi.org/10.3390/nu9040388
34. Maciá-Botejara E, Morán-Penco JM, Espín-Jaime MT, Botello-Martínez F, Salas-Martínez J, Caballero-Loscos MJ, Molina-Fernández M. Brain lipid composition in rabbits after total parenteral nutrition with two different lipid emulsions. Nutrition. 2013 Jan 1;29(1):313-7. https://doi.org/10.1016/j.nut.2012.07.020
35. Ballesteros-Pomar MD, Leon-Sanz M 2013 Prescription of artificial nutrition in patients with dyslipidaemia. In: Nutrition in Lipidemias. ESPEN LLL Programme. http://www.testlllnutrition.com/mod_lll/TOPIC22/m222.pdf Accessed 15April 2019.
36. Zavod RM. Essentials of nutrition. Nutrition in Pharmacy Practice. American Pharmaceutical Association. 2002; pp 1-50.
37. Graham J. The Rabbit Liver in Health and Disease. House Rabbit Society. http://www.rabbit.org/health/liver
38. Meredith A, Rayment L. Liver disease in rabbits. InSeminars in Avian and Exotic Pet Medicine 2000 Jul 1 (Vol. 9, No. 3, pp. 146-152). WB Saunders. https://doi.org/10.1053/ax.2000.7135
39. Ray CS, Singh B, Jena I, Behera S, Ray S. Low alkaline phosphatase (ALP) in adult population an indicator of zinc (Zn) and magnesium (Mg) deficiency. Current Research in Nutrition and Food Science Journal. 2017 Dec 24;5(3):347-52. https://doi.org/10.12944/CRNFSJ.5.3.20
40. Onyesom I, Anosike EO. Changes in rabbit liver function markers after chronic exposure to ethanol. Asian J. Biochem. 2007;2:337-42. https://doi.org/10.3923/ajb.2007.337.342
41. Özkan C, Kaya A, Akgül Y. Normal values of haematological and some biochemical parameters in serum and urine of New Zealand White rabbits. World Rabbit Science. 2012 Dec 28;20(4):253-9. https://doi.org/10.4995/wrs.2012.1229
42. Shousha SM, Mahmoud MA, Hameed K. Some haemato-biochemical value in white New Zealand rabbits. IOSR J Agric Vet Sci. 2017;10(7):40-4. https://doi.org/10.9790/2380-1007014044
43. Parry SA, Hodson L. Influence of dietary macronutrients on liver fat accumulation and metabolism. Journal of Investigative Medicine. 2017 Dec;65(8):1102-15. https://doi.org/10.1136/jim-2017-000524
44. Zhu X, Zhang X, Yu L, Xu Y, Feng X, Wang J. Hepatic overexpression of GRP94 in a rabbit model of parenteral nutrition-associated liver disease. Gastroenterology Research and Practice. 2015 Mar 30;2015. https://doi.org/10.1155/2015/269831
45. Jin R, Banton S, Tran VT, Konomi JV, Li S, Jones DP, Vos MB. Amino acid metabolism is altered in adolescents with nonalcoholic fatty liver disease—An untargeted, high resolution metabolomics study. The Journal of pediatrics. 2016 May 1;172:14-9. https://doi.org/10.1016/j.jpeds.2016.01.026
46. Lee WC, Noh HB, Hussain KK, Min SJ, Shim YB. Nicotine and tyrosine detection in blood and urine samples using taurine/reactive blue-immobilized conducting polymer composite. Sensors and Actuators B: Chemical. 2018 Dec 1;275:284-91. https://doi.org/10.1016/j.snb.2018.08.039
47. Persico M, Iolascon A. Steatosis as a co-factor in chronic liver diseases. World Journal of Gastroenterology: WJG. 2010 Mar 3;16(10):1171. https://doi.org/10.3748/wjg.v16.i10.1171
48. Kalish BT, Le HD, Gura KM, Bistrian BR, Puder M. A metabolomic analysis of two intravenous lipid emulsions in a murine model. Plos one. 2013 Apr 2;8(4):e59653. https://doi.org/10.1371/journal.pone.0059653
49. Kassas N, Tryoen-Tóth P, Corrotte M, Thahouly T, Bader MF, Grant NJ, Vitale N. Chapter 20 - Genetically Encoded Probes for Phosphatidic Acid. In:Methods in Cell Biology.Elsevier Inc., Amsterdam, 2012;pp 445-459.
50. Stillwell W. Bioactive Lipids. In: An Introduction to Biological Membranes. Elsevier Inc., Amsterdam, 2016;pp 453-478.
51. Cheng SB, Liu HT, Chen SY, Lin PT, Lai CY, Huang YC. Changes of oxidative stress, glutathione, and its dependent antioxidant enzyme activities in patients with hepatocellular carcinoma before and after tumor resection. PloS one. 2017 Jan 12;12(1):e0170016. https://doi.org/10.1371/journal.pone.0170016
52. Pasini E, Corsetti G, Aquilani R, Romano C, Picca A, Calvani R, Dioguardi FS. Protein-amino acid metabolism disarrangements: The hidden enemy of chronic age-related conditions. Nutrients. 2018 Mar 22;10(4):391. https://doi.org/10.3390/nu10040391
53. Küskü-Kiraz Z, Genc S, Bekp?nar S, Ünlücerci Y, Çevik A, Olgaç V, Gürdöl F, Uysal M. Effects of betaine supplementation on nitric oxide metabolism, atherosclerotic parameters, and fatty liver in guinea pigs fed a high cholesterol plus methionine diet. Nutrition. 2018 Jan 1;45:41-8. https://doi.org/10.1016/j.nut.2017.07.005