Polyploid Goes to Genomics
Author: Zhao-Bang Zeng1,2*, Marcelo Mollinari1,2, Guilherme da Silva Pereira3, Bode A. Olukolu4, and G. Craig Yencho1
1Department of Horticultural Science, North Carolina State University, Raleigh, NC 27695, USA
2Bioinformatics Research Center, North Carolina State University, Raleigh, NC 27695, USA
3Department of Agronomy, Federal University of Vi
Citation: Zhao-Bang Zeng, Marcelo Mollinari, Guilherme da Silva Pereira, Bode A. Olukolu and G. Craig Yencho (2022) Polyploid Goes to Genomics, 21st Century Pathol, Volume 2 (2): 113
Abstract
Due to a very complex genetic structure resulting from many segregating alleles and allelic combinations in families, polyploid species have lagged behind diploid species significantly in the applications of genomics. The high-throughput DNA sequence technology has brought the opportunity to assess these complex genome segregation patterns through quantitative reduced representation sequencing (qRRS) and the calling of SNP-binary dosage markers combined with the newly developed computational tools. We briefly review our efforts in developing a pipeline of computational tools from raw DNA sequences to call dosage markers, to construct linkage map, to map quantitative trait loci (QTL) and to perform genomics selection for autopolyploid full-sib families. It is time for polyploids to catch up with diploids in the era of genomics.
Keywords:
Polyploid genetics; Polyploid genomics; Linkage analysis; QTL mapping; Disease resistance; Plant breeding
Introduction
Many important agricultural species are polyploids. They range from staple food crops (potato, sweetpotato) to fruits (strawberry, kiwi, blueberry, and banana), ornamental flowers (chrysanthemum), forage crops, turfgrass, and sugar and energy production crops (sugarcane). Polyploid crops have multiple copies of the complete set of chromosomes. They can originate from the fusion or duplication of genomes during evolutive and breeding processes. In the first case, they are referred to as allopolyploids, and in the latter, autopolyploids.
Many important agricultural species are polyploids. They range from staple food crops (potato, sweetpotato) to fruits (strawberry, kiwi, blueberry, and banana), ornamental flowers (chrysanthemum), forage crops, turfgrass, and sugar and energy production crops (sugarcane). Polyploid crops have multiple copies of the complete set of chromosomes. They can originate from the fusion or duplication of genomes during evolutive and breeding processes. In the first case, they are referred to as allopolyploids, and in the latter, autopolyploids.
Many polyploid crops are highly heterogeneous and could have significant inbreeding depression when inbred. This fact rules out the practicality of using homozygous lines in polyploid breeding programs. As the vast majority of polyploid species are clonally propagated, the basic breeding approach used for polyploidy crops is recurrent phenotypic selection with little or no input from genomic information. The structure of practical breeding populations is typically composed of several (partially) inter-related families in complex pedigrees with many families and relatively small family sizes (typically about 10-20). All these impose unusually hard challenges for an informed and efficient application of genomics for practical breeding in polyploid crops. Yet as these crops require significant field space, time of breeding cycle, and workforce, running these breeding programs is very costly. In a rapidly changing world in need of assertive breeding strategies, a case can be made that using genomic information for breeding, though technically very challenging, can save time and money, if implemented properly with efficiency.
One of the most significant advances in the polyploid genetic analysis in the last decade was the possibility of assessing these complex genomes using high-throughput DNA sequence technology [2, 3]. Such technology can now deliver inexpensive and massive amounts of DNA sequences which can be analyzed and converted into quantitative SNP-binary dosage markers. This technological advance made it possible for an in-depth polyploid genome analysis. Although the genetic information of each individual SNP dosage marker can be very limited, highly incomplete and error-prone, especially for high-ploidies, large amounts of these markers can provide sufficient information for us to infer the genetic inheritance in polyploid populations [1, 3].
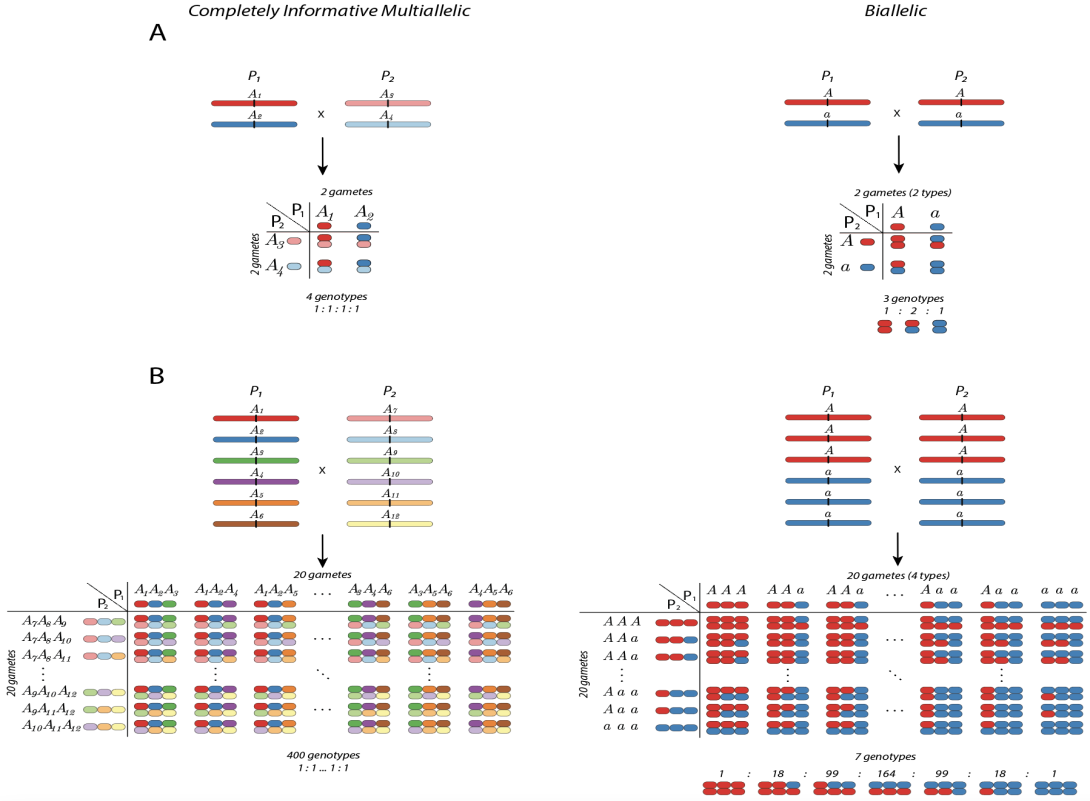
Figure 1: Comparison between diploid and hexaploid complexity. A) At the left panel, four possible genotypes from a diploid biparental cross are collapsed in three classes (AA, Aa, aa) when assessed using a biallelic marker at the right panel. B) The four hundred possible hexaploid genotypes in the left panel collapsed into seven genotypic classes when assessed with biallelic markers with three doses in both parents. Notice that the information loss in the hexaploid case, from 400 to seven classes, is much more critical than the diploid case.
In recent years, polyploid genetic analysis has been gaining strength and attention, and several software programs are now available to the polyploid scientific community. Haplotype-based calling tools (e.g. GATK and FreeBayes) are particularly more amenable to dosage-based variant calling in contrast to variant callers (e.g. Tassel, STACK, and SAMtools) developed for diploids. Other tools developed to improve accuracy of dosage-based genotyping in bi-parental and/or non-family-based populations include FitPoly [4], SuperMASSA [5], VCF2SM [6], updog [7], and polyRAD [8]. Some of these tools account for common problematic features in NGS data such as base calling error, allele bias, and over dispersion. All of them provide dosages of genome-wide SNP variants. On the linkage analysis front, programs such as TetraploidSNPmap [9], polymapR [10], and MAPpoly [1, 3] can use dosage-based markers to build genetic maps and obtain the linkage phase information in full-sib mapping populations. In a linkage analysis, we would like to infer the order, position, and parental phase of markers, and moreover the transmission patterns of the parental homologs across generations. Ultimately, we would like to be able to infer the complete probabilistic haplotype inheritance patterns of any individual in a segregating population in terms of their respective parental haplotypes. Programs such as Tetra Origin [11], PolyOrigin [12] and MAPpoly [1, 3] implemented this complicated task. While the first two programs depend on genetic maps and implement this procedure only for tetraploid families, MAPpoly can perform this task in ploidy levels as high as octaploid and does not depend on a pre-existing framework map. The haplotypic probabilities generated by the map construction are used to estimate the position, number, and genetic effects of genomic regions associated with important agronomic traits (QTL mapping). This is important for us to understand the genetic basis of trait variation in a population. Also, by using this information, breeders can benefit from the inferred genome-wide genotype and phenotype relationship to make informed breeding decisions (marker-assisted selection and genomic selection). Software for performing such analysis in polyploids includes QTLpoly [13], polyqtlR [2], DiaQTL [14], and GWASpoly [15].
Thus in order to use genomic information for breeding, we need powerful and efficient computational tools that can process raw DNA sequence data to call genetic markers (marker identification); from markers to construct a genetic linkage map (linkage map construction and haplotype inference); use the map to locate candidate genes that are important to trait phenotypes (QTL mapping), and use the inferred genotype-phenotype relationship to make informed decisions for breeding (QTL aided selection or genomic selection).
In the last few years, our group has been developing some of the tools mentioned above (VCF2SM, SuperMASSA, MAPpoly, and QTLpoly) to help polyploid breeders and geneticists to perform genomic analysis. VCF2SM integrates a pipeline of data analysis programs from raw DNA sequences for SuperMASSA to call dosage markers [6]. SuperMASSA is a program that implements a graphical Bayesian network model to infer genotypes even when the ploidy level is unknown [5]. SuperMASSA uses as input the abundance of the reference and alternate allelic variants for a specific genome locus and models their distribution using expected ratios and the allelic frequency of the analyzed population under a range of ploidy levels. The program then computes the maximum a posteriori configuration of the Bayesian network obtaining the most likely ploidy level and genotype configuration for all individuals in the population. One could also obtain the probability distribution for the genotypes, which can be used in subsequent genetic analysis. We used SuperMASSA to perform the genotype dosage calling in several sweetpotato biparental populations, including the Beauregard x Tanzania (BT), which served as the basis to develop our mapping and QTL analysis algorithms [3, 13, 17 and 16].
One of the major initiatives we have taken in the last several years was the development and implementation of a complete solution to construct genetic maps in full-sib families. Our solution uses multilocus hidden Markov model (HMM) analysis and works for even ploidy levels from diploids up to autooctaploids [1, 3]. The model uses, as input, the probability distribution of biallelic dosage marker genotypes, and by using the information from multiple markers to recover and infer the multiple polyploid genotypes that are present in the segregating population. The concept of HMM in the context of genetic mapping [18] is to use multiple linked markers to estimate the parental linkage phase, the genetic distance between markers, and reconstruct the offspring haplotypes. Thus, by using the various sources of interconnected evidence (multiple SNPs and individuals), HMM can aggregate multiple SNP information and also reduce the intrinsic high error rate in individual marker dosage callings in polyploid species. The use of multilocus analysis to construct genetic maps and offspring haplotypes in polyploids is extremely important for both information recovery and marker data quality control.
In order to make the multipoint map construction available to the scientific community, we developed and freely released MAPpoly (https://cran.r-project.org/web/packages/mappoly/). MAPpoly is an R package to construct genetic maps in autopolyploids with even ploidy levels. In its current version (0.2.3), MAPpoly can handle even ploidy levels up to 8 when using hidden Markov models (HMM), and up to 12 when using the two-point simplification. It contains several functions that perform all the steps in the whole linkage analysis pipeline, such as loading a variety of dosage-based datasets, including genotype probabilities, filtering procedures, pairwise linkage analysis, clustering linkage groups, ordering markers, phasing and multipoint map estimation, computation of genotype probabilities for further QTL analysis, and inference of meiotic processes. It also contains functions to communicate with other polyploid analysis packages such as fitPoly, updog, polyRAD, and polymapR. The initial implementation of MAPpoly was limited to biparental populations and successfully used to construct an integrated sweetpotato genetic map in a full-sib population of Beauregard x Tanzania (BT), the first multilocus genetic map for an autohexaploid species [3] (Figure 2). The effort is underway to extend it to multiple inter-connected families.
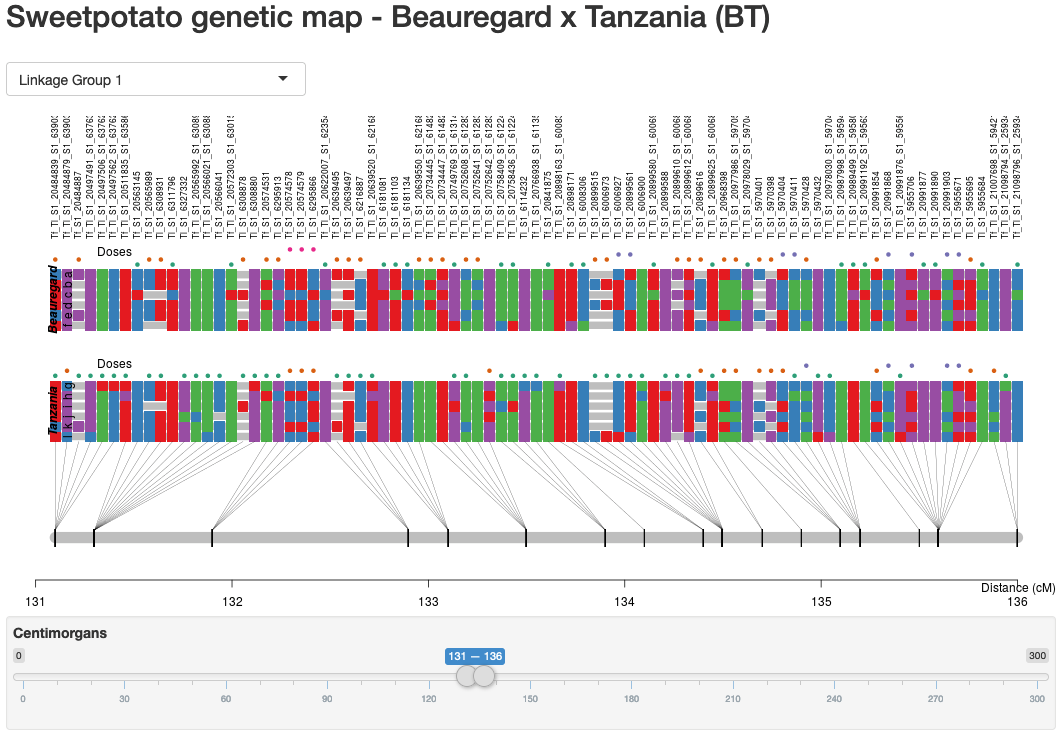
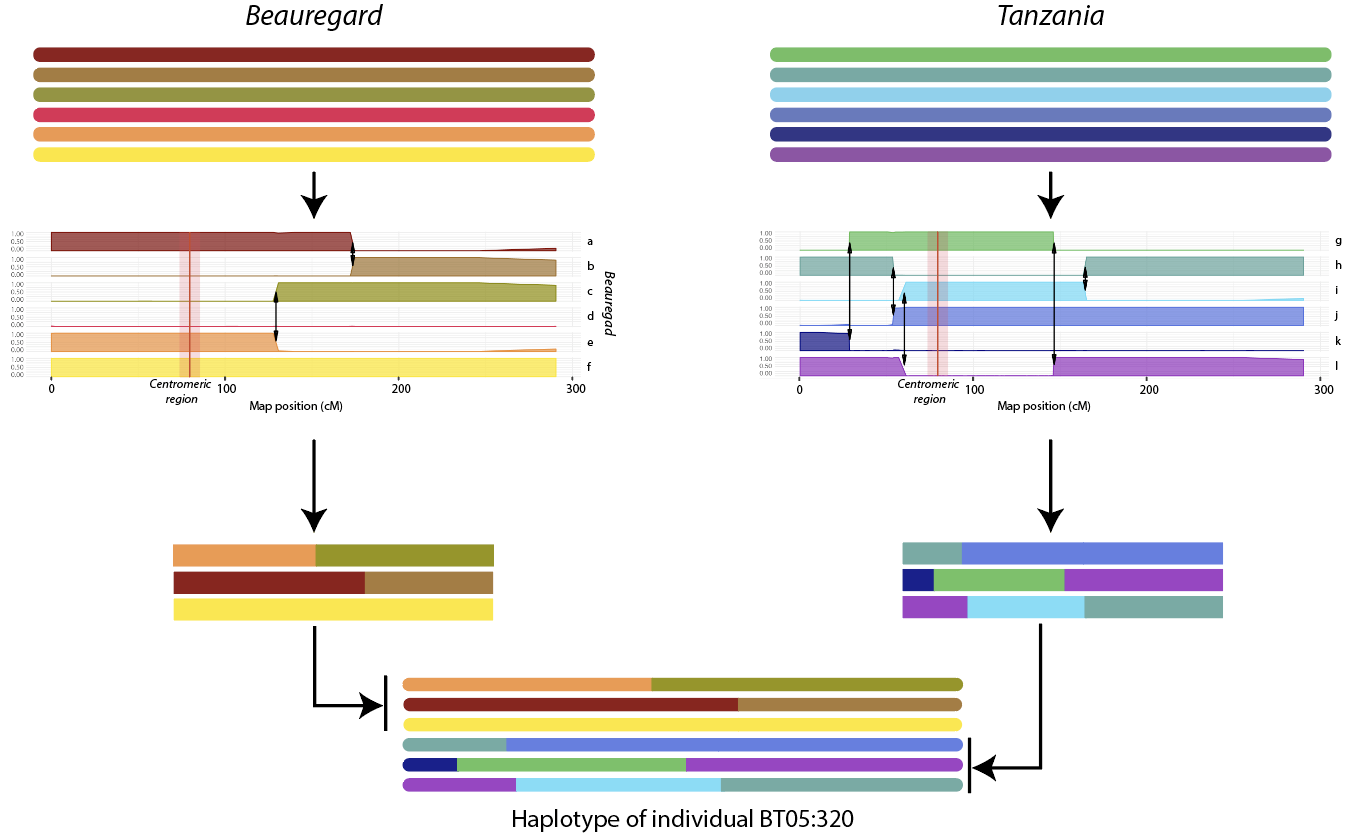
Figure 2: 2A: A snapshot of the inferred genetic map of linkage group 1 for sweetpotato Beauregard x Tanzania (BT) population. For each marker the information includes maker name, dosage, haplotype makeup, genome position and genetic map distance. Detailed information is available at https://gt4sp-genetic-map.shinyapps.io/bt_map/; 2B: The inferred haplotype of individual BT05:320 for linkage group 1 in terms of parental haplotypes.
For QTL mapping, we aim to interpret the genetic basis of quantitative trait variation in a population for genetic discovery and prediction. Due to a potentially large number of alleles at each QTL locus in polyploid populations, we developed a random QTL-effect model for mapping multiple QTL. The multiple QTL are searched sequentially. QTL effect parameter estimation is based on a mixed-effect model with REML. The test statistic for QTL identification is based on a score-statistic to compute empirical p-values efficiently. The method is general and flexible and can be readily extended for multiple families.
We developed QTLpoly (https://cran.r-project.org/web/packages/qtlpoly/) in an R package for a general QTL mapping analysis in polyploid populations [12]. QTLpoly takes the output of haplotype structure inferred from MAPpoly as an input in terms of the genotype conditional probability distribution at each genomic position for each individual and combines it with phenotypes to perform a variety of genetic analyses between genotypes and phenotypes. It can perform the genomic selection (GS) and prediction. But more importantly it can build a clearly defined and flexible genetic model that can achieve the purposes of both genetic discovery and breeding value prediction for selection. SP GD, et al. (2020) [13] reported the mapping of a number of QTL for both qualitative traits and yield traits.
For disease resistance, SP GD, et al. (2021) [19] reported the mapping of a major QTL for common scab resistance in a tetraploid potato full-sib population. Based on the genome information of the mapped region, a number of candidate genes were suggested. Such a mapping and identification of QTL haplotypes would facilitate the application of genome-assisted breeding for disease resistance and also for the identification of the causal gene. Also, Oloka BM, et al. (2021) [17] reported the mapping of a major QTL for root-knot nematode (Meloidogyne incognita) resistance in sweetpotato. They identified the genetic inheritance model (duplex-dominant) and specific SNP that are linked to the resistance.
Based on the QTL mapping of SP GD et al. (2020), Gemenet DC, et al. (2020) [13,16] reported an interesting and important study on the comparison of predictive abilities of different methods (measured as the correlation between the predicted and observed phenotypes in the validation sample based on an10-fold cross-validation) (Figure 3). The message is clear: a fuller genetic analysis can achieve not only a clear genetic discovery (identification of specifical QTL in the genome, specifical alleles and allelic combinations in terms of parental haplotypes, a genetic model of casual variants, and the importance of QTL effects in terms of heritability) but also better prediction for breeding.
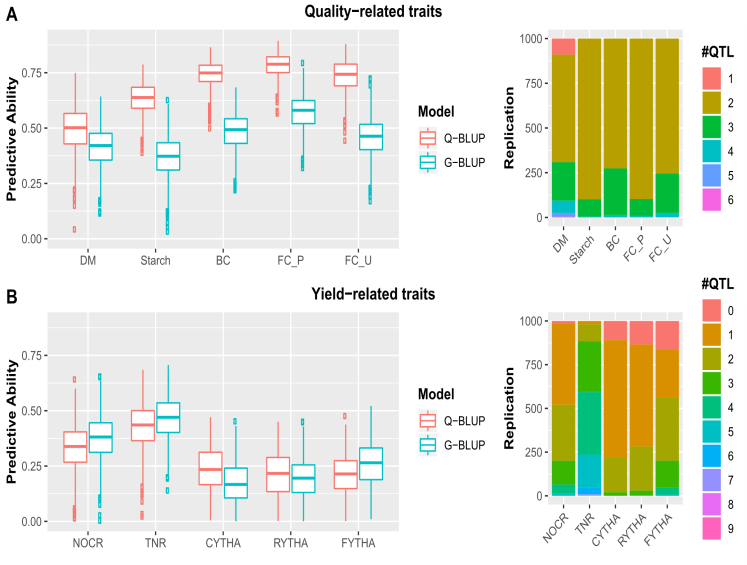
Figure 3: The left panel: a comparison of different mapping analysis in the BT population of sweetpotato based on a 10-fold cross-validation on the qualitative traits (A) and yield-related traits (B): diploid-like markers vs. dosage markers vs. haplotypes. Predictive ability is the correlation between the predicted and observed phenotypes on the validation sample. The dosage marker analysis performs better than the diploidized marker analysis, and the haplotype-based analysis performs better than the dosage marker analysis. The right panel: the similar comparison between a QTL-based analysis and the genomic selection (GS) (based on all markers with the constructed haplotypes). It shows that a QTL-based analysis can achieve better predictive power, or as powerful as GS in the case of yield-related traits). If we put both aspects (the issues involved with the left and right-panels) together for comparison, the difference would be more profound [16].
However, to make these tools applicable to the practical breeding situation, we need to consider the complex family structure of polyploid breeding populations, typically in the form of multiple partially inter-related families. There are several technical challenges that need to be overcome for such an extension. Still, the time is ripe for the polyploid community to earnestly consider using genomics in their studies and breeding. It is time for polyploids to catch up with diploids in the era of genomics.
Funding
This research was fund by Bill & Melinda Gates Foundation [OPP1052983, OPP1213329] and by the National Institute of Food and Agriculture, USDA Specialty Crop Research Institute project ?Tools for Genomics-Assisted Breeding of Polyploids: Development of a Community Resource? (2020-02585).
Financial disclosure
The author declares no relevant financial or non-financial relationships to disclose.
Conflict of Interest
No potential conflict of interest relevant to this article was reported.
References
1. Mollinari M, Garcia AA. Linkage analysis and haplotype phasing in experimental autopolyploid populations with high ploidy level using hidden Markov models. G3: Genes, Genomes, Genetics. 2019 Oct 1;9(10):3297-314. https://doi.org/10.1534/g3.119.400378
2. Bourke PM, van Geest G, Voorrips RE, Jansen J, Kranenburg T, Shahin A, Visser RG, Arens P, Smulders MJ, Maliepaard C. polymapR—linkage analysis and genetic map construction from F1 populations of outcrossing polyploids. Bioinformatics. 2018 Oct 15;34(20):3496-502. https://doi.org/10.1093/bioinformatics/bty371
3. Mollinari M, Olukolu BA, Pereira GD, Khan A, Gemenet D, Yencho GC, Zeng ZB. Unraveling the hexaploid sweetpotato inheritance using ultra-dense multilocus mapping. G3: Genes, Genomes, Genetics. 2020 Jan 1;10(1):281-92. https://doi.org/10.1534/g3.119.400620
4. Voorrips RE, Gort G, Vosman B. Genotype calling in tetraploid species from bi-allelic marker data using mixture models. BMC bioinformatics. 2011 Dec;12(1):1-1. https://doi.org/10.1186/1471-2105-12-172
5. Serang O, Mollinari M, Garcia AA. Efficient exact maximum a posteriori computation for Bayesian SNP genotyping in polyploids. PLoS One. 2012 Feb 17;7(2):e30906. https://doi.org/10.1371/journal.pone.0030906
6. Pereira GS, Garcia AA, Margarido GR. A fully automated pipeline for quantitative genotype calling from next generation sequencing data in autopolyploids. BMC bioinformatics. 2018 Dec;19(1):1-0. https://doi.org/10.1186/s12859-018-2433-6
7. Gerard D, Ferrão LF, Garcia AA, Stephens M. Genotyping polyploids from messy sequencing data. Genetics. 2018 Nov 1;210(3):789-807. https://doi.org/10.1534/genetics.118.301468
8. Clark LV, Lipka AE, Sacks EJ. polyRAD: Genotype calling with uncertainty from sequencing data in polyploids and diploids. G3: Genes, Genomes, Genetics. 2019 Mar 1;9(3):663-73. https://doi.org/10.1534/g3.118.200913
9. Hackett CA, Boskamp B, Vogogias A, Preedy KF, Milne I. TetraploidSNPMap: software for linkage analysis and QTL mapping in autotetraploid populations using SNP dosage data. Journal of Heredity. 2017 Jun 1;108(4):438-42. https://doi.org/10.1093/jhered/esx022
10. Bourke PM, Voorrips RE, Visser RG, Maliepaard C. Tools for genetic studies in experimental populations of polyploids. Frontiers in plant science. 2018 Apr 18;9:513. https://doi.org/10.3389/fpls.2018.00513
11. Zheng C, Voorrips RE, Jansen J, Hackett CA, Ho J, Bink MC. Probabilistic multilocus haplotype reconstruction in outcrossing tetraploids. Genetics. 2016 May 1;203(1):119-31. https://doi.org/10.1534/genetics.115.185579
12. Zheng C, Amadeu RR, Munoz PR, Endelman JB. Haplotype reconstruction in connected tetraploid F1 populations. Genetics. 2021 Oct;219(2):iyab106. https://doi.org/10.1093/genetics/iyab106
13. da Silva Pereira G, Gemenet DC, Mollinari M, Olukolu BA, Wood JC, Diaz F, Mosquera V, Gruneberg WJ, Khan A, Buell CR, Yencho GC. Multiple QTL mapping in autopolyploids: a random-effect model approach with application in a hexaploid sweetpotato full-sib population. Genetics. 2020 Jul 1;215(3):579-95. https://doi.org/10.1534/genetics.120.303080
14. Amadeu RR, Munoz PR, Zheng C, Endelman JB. QTL mapping in outbred tetraploid (and diploid) diallel populations. Genetics. 2021 Nov;219(3):iyab124. https://doi.org/10.1093/genetics/iyab124
15. Rosyara UR, De Jong WS, Douches DS, Endelman JB. Software for genome?wide association studies in autopolyploids and its application to potato. The plant genome. 2016 Jul;9(2):plantgenome2015-08. https://doi.org/10.3835/plantgenome2015.08.0073
16. Gemenet DC, da Silva Pereira G, De Boeck B, Wood JC, Mollinari M, Olukolu BA, Diaz F, Mosquera V, Ssali RT, David M, Kitavi MN. Quantitative trait loci and differential gene expression analyses reveal the genetic basis for negatively associated β-carotene and starch content in hexaploid sweetpotato [Ipomoea batatas (L.) Lam.]. Theoretical and Applied Genetics. 2020 Jan;133(1):23-36. https://doi.org/10.1007/s00122-019-03437-7
17. Oloka BM, da Silva Pereira G, Amankwaah VA, Mollinari M, Pecota KV, Yada B, Olukolu BA, Zeng ZB, Craig Yencho G. Discovery of a major QTL for root-knot nematode (Meloidogyne incognita) resistance in cultivated sweetpotato (Ipomoea batatas). Theoretical and Applied Genetics. 2021 Jul;134(7):1945-55. https://doi.org/10.1007/s00122-021-03797-z
18. Bourke PM. Genetic mapping in polyploids (Doctoral dissertation, Wageningen University and Research).
19. da Silva Pereira G, Mollinari M, Qu X, Thill C, Zeng ZB, Haynes K, Yencho GC. Quantitative trait locus mapping for common scab resistance in a tetraploid potato full-sib population. Plant Disease. 2021 Oct 29;105(10):3048-54. https://doi.org/10.1094/PDIS-10-20-2270-RE