Phenotypic Identification of Patients with Abnormal CYP2D6 or CYP3A4/5 Metabolism from Routine Oxycodone Monitoring
Authors: Nicholas J. Bevins1, Kendal J. Jensen2, Paul S. Horn3, and Amadeo J. Pesce1,2*
1Department of Pathology, University of California at San Diego, USA
2Precision Diagnostics Inc., USA
3Neurology Division, Cincinnati Children’s Hospital, College of Medicine, University of Cincinnati, USA
*Correspondence to: Professor. Amadeo J. Pesce, Precision Diagnostics LLC, San Diego CA 92121, USA; E-mail: amadeo.pesce@gmail.com
Received: June 05, 2022; Revision: August 10, 2022; Accepted: August 12, 2022; Published: August 15, 2022
Citation: Nicholas J. Bevins, Kendal J. Jensen, Paul S. Horn and Amadeo J. Pesce (2022) Phenotypic Identification of Patients with Abnormal CYP2D6 or CYP3A4/5 Metabolism from Routine Oxycodone Monitoring, 21st Century Pathology, Volume 2 (4): 126
Abstract
Background: Individual genetic differences in the cytochrome p450 oxidase family of enzymes are responsible for most aberrantly fast or slow drug metabolisms leading to therapeutic failures or unexpected toxicity. The purpose of this work was to identify fast or slow metabolizers of oxycodone based on their quantitative urine drug tests. Our hypothesis was that metabolic ratios of oxycodone to metabolite measured in urine can be used to identify aberrant metabolism and be the basis to perform definitive genetic testing on these patients. We extended this concept to drugs commonly monitored for pain management.
Methods and Findings: We utilized a dataset of 174,145 observations from 16,400 patients to 1) develop oxycodone/ metabolite ratio reference range enabling identification of CYP2D6 and CYP3A4/5 abnormally fast or slow metabolizers and 2) validate predicted metabolism using co-incident observations of other drugs/ metabolite pairs.
The prevalence of predicted CYP2D6 fast and slow metabolizers was 3.4% and 7.6%, respectively. The prevalence of predicted CYP3A4/5 fast and slow metabolizers was 7.2% and 7.1%, respectively. These prevalence rates are consistent with genotypic studies. Metabolic ratios of co-incidentally observed dextromethorphan/ dextrorphan, a drug metabolite pair classically utilized to assess CYP2D6 metabolism, were lowest in predicted CYP2D6 slow metabolizers and lowest in predicted CYP2D6 fast metabolizers. Predicted CYP3A4/5 metabolism did not correlate with dextromethorphan/ dextrorphan. Correlation between metabolic ratios of 12 other drug/ metabolite pairs and predicted CYP2D6 and CYP3A4/5 kinetics are also reported. Individual patients with metabolic ratios consistently outside the reference range were identified. These patients could either be aberrant metabolizers, be taking drugs that inhibit metabolism, or the specimens may have been contaminated with the parent drug.
Conclusion: Development and utilization of a reference range for metabolic ratios can enable the detection of aberrant drug metabolism from routine urine drug monitoring observations. These observations suggest definitive pharmacogenetic testing is appropriate for these individuals.
Keywords:
Cytochrome p450; Drug metabolism; Metabolic ratio; CYP2D6; CYP3A4/5
Highlights
- Urine metabolic ratios of oxycodone to metabolite can be used to identify aberrant metabolism.
- Identification of fast or slow metabolizers of oxycodone based on their quantitative urine drug tests.
- Use oxycodone/ metabolite ratio reference range to identify CYP2D6 and CYP3A4/5 fast or slow metabolizers.
- Reference range for metabolic ratios can detect aberrant drug metabolism from routine urine drug monitoring.
- Correlate metabolic ratios of 12 other drug/ metabolite pairs to predict CYP2D6 and CYP3A4/5 kinetics.
Background
The United States Federal Government has indicated that it supports Precision Medicine [1]. Part of the development of Precision Medicine is the use of genetic markers. However, recent legal actions by the US Federal Government indicate it is not prepared to pay for these tests [2]. The audit cited here ?might be an early sign that federal health programs consider pharmacogenomic tests essential to the practice of precision medicine to be a clinical service that would bust their budgets if tens of millions of Americans were candidates for this testing in coming years. Thus, could this audit be an early signal from federal health officials that they are not prepared to cover pharmacogenomic tests?? [2].
The essential issue in ordering pharmacogenomic testing is whether it is medically necessary. We propose that the urine drug testing information obtained as a part of the clinical practice of opioid prescribing or substance abuse testing can be used to identify patients who would benefit from pharmacogenomic testing.
Individual variation in genes within the cytochrome p450 oxidase family is responsible for the unexpectedly fast or slow metabolism of many commonly used drugs [3,4]. Of the top 200, most prescribed FDA-approved drugs, approximately 43% are metabolized by CYP3A4/5 enzymes and 21% by the CYP2D6 enzyme [5]. Individuals with either gain-of-function or loss-of-function mutations in the CYP3A4/5 or CYP2D6 genes can have abnormally fast or abnormally slow metabolism of drugs, leading to unexpected outcomes from many commonly used drugs because of abnormally fast or slow conversion of compounds to or from active forms [6-8]. A few examples of such unexpected outcomes are 1) the association of abnormally slow CYP2D6 metabolism with increased toxicity from antidepressants [7], 2) the ineffective conversion of the pro-drug tamoxifen to the more potent metabolite endoxifen by CYP2D6 slow metabolizers leading to ineffective breast cancer therapy [9,10], and 3) slow conversion of inactive codeine to morphine leading to a lack of analgesic effect [9,11].
Clinical guidelines recommend pharmacogenomic testing of CYP2D6 or CYP3A4/5 for more than 50 drugs [10]. However, genotypic testing of CYP genes is complex and difficult to interpret, leading to high costs and ongoing debates regarding the clinical value of testing [4]. For example, in the case of CYP2D6 testing for tamoxifen therapy differences in testing methodology between labs can lead to very different results for the same patient, assessing the overall value of testing very difficult [11]. Efforts are underway to standardize pharmacogenomics testing, but such testing is likely to have high costs and questionable value in the near future due to technical complexity [12].
Historically, metabolic differences have been established by administering tracer drugs such as dextromethorphan and monitoring the rate of formation of its metabolite dextrorphan [13]. Drug/metabolite pairs in urine have been used to establish metabolic phenotypes for many substances [14-25]. We propose that monitoring the concentration of drugs and their metabolites during routine urine drug testing of patients undergoing opioid therapy could enable a phenotypic classification of a patient?s metabolic status. That is, they will metabolize these drugs as a function of the underlying genotype of their CYP450 enzymes.
We here examine the metabolic ratio (ratio of drug/ metabolite) of the drug oxycodone and its metabolites oxymorphone and noroxycodone. Oxymorphone is formed by the CYP2D6 enzyme and noroxycodone is formed by the CYP3A4/5 enzyme (Figure 1A) [26]. We postulated that fast metabolizers would deplete the amount of parent drug and convert it to its metabolite more quickly than the common (extensive) metabolizers leading to low ratios of parent drug to metabolite (Figure 1B). Conversely, slow metabolizers would be slow to convert the parent drug to its metabolite and would appear to have high parent drug to metabolite ratios (Figure 1B).
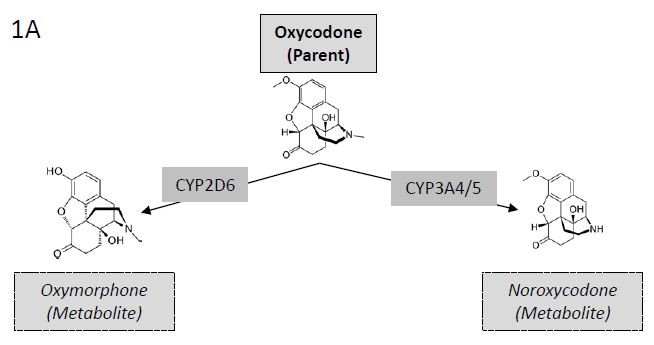
Figure 1A: Metabolites of Oxycodone. Illustration of (left) oxycodone conversion to oxymorphone by CYP2D6 mediated O-demethylation and (right) oxycodone conversion to noroxycodone by CYP3A4/5 mediated N-demethylation.
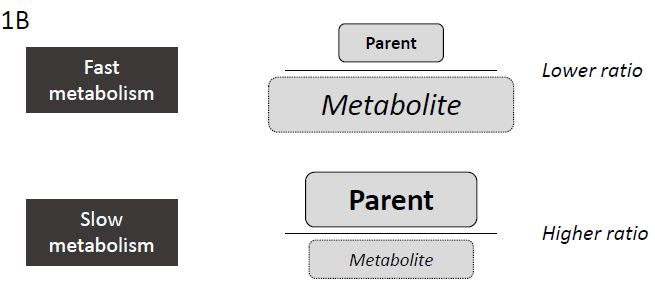
Figure 1B: Correlation between Metabolic Rate and Metabolic Ratio. Illustration of relationship between metabolism kinetics (fast or slow) and metabolic ratio of drug to metabolite.
Methods
Primary Data Collection
The data from more than 1 million quantitative urine drug screens performed at Precision Diagnostics (San Diego, CA, USA) was sorted. Drugs and metabolites were measured using a multiplexed, high-sensitivity, clinically validated LC-MS/MS method as previously described [27].
An arbitrary patient identification number and unique specimen number was assigned to all specimen results. 174,145 observations from 74,164 patients with a valid measured concentration of oxycodone, oxymorphone, AND noroxycodone were identified for further analysis. The study was approved by Aspire IRB (Santee, CA, USA).
Reference Range Development
Patients with a ?stable? drug/metabolite ratio between observations were extracted from the larger data set (Figure 1C). Of the 174,145 observations available for analysis we extracted observations from patients with 3 or more results and with concentrations of oxycodone >300 ng/mL, oxymorphone >50 ng/mL, and noroxycodone >50 ng/mL for further analysis. The resulting 91,121 observations from 16,400 patients were then further screened to include only observations from patients with an intra-patient drug/metabolism coefficient of variation less than 10%. Observations from the resulting 167 patients meeting criteria for a stable oxycodone/ oxymorphone ratio were then used to establish a reference range for CYP2D6 metabolism and observations from the resulting 369 patients meeting criteria for a stable oxycodone/ noroxycodone ratio were then used to establish a reference range for CYP3A4/5 metabolism. For the 167 patients with stable oxycodone/ oxymorphone ratios the mean, standard deviation and maximum number of observations was 3.2, 0.50, and 6. For the 369 patients with stable oxycodone/ noroxycodone ratios the mean, standard deviation and maximum number of observations was 3.3, 0.71, and 8.
Median drug/metabolite ratios for each ?stable? patient were used as the reference population to establish cut-offs using the robust reference range development method described [28].
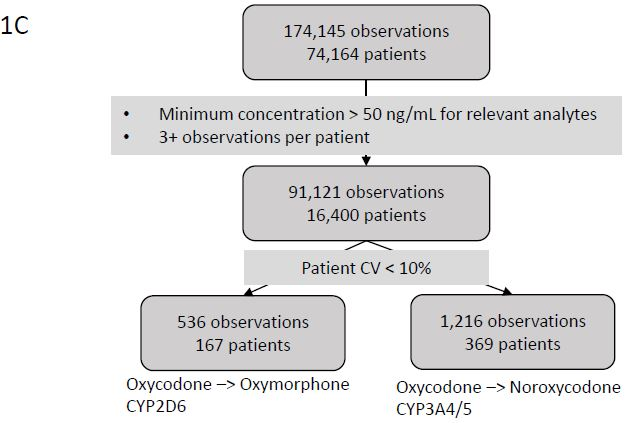
Figure 1C: Consort Diagram for Reference Range. Consort diagram of patients and observations used to identify a patient population with a stable metabolic ratio for generation of a reference range.
Metabolic Rate Classification
Of the 174,145 observations available for analysis we extracted observations with concentrations of oxycodone, oxymorphone, and noroxycodone all > 50 ng/mL and excluded those observations used for reference range development yielding 164,024 observations from 68,570 patients for further analysis (Figure 1D). Oxycodone/ oxymorphone ratios below the 2.5th percentile reference range value were described as ?CYP2D6 fast? metabolizers and oxycodone/oxymorphone ratios above the 95th percentile reference range value are described as ?CYP2D6 slow? metabolizers. The observed distribution of CYP2D6 fast and slow metabolizers is approximately equivalent to that observed in large-scale molecular testing in a North American population [29]. Oxycodone/ noroxycodone ratios below the 2.5th percentile reference range value were described as ?CYP3A4/5 fast? metabolizers and oxycodone/noroxycodone ratios above the 95th percentile reference range value are described as ?CYP3A4/5 slow? metabolizers.
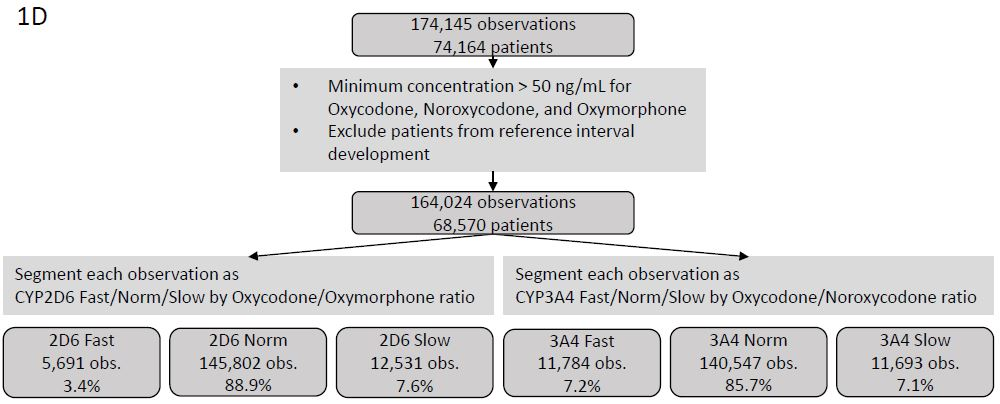
Figure 1D: Consort Diagram for Coincidental Observations. Consort diagram of patients and observations used to test the utility of predicted CYP2D6 and CYP3A4/5 phenotype based on oxycodone/metabolite ratios.Ratios of other drugs/metabolite pairs incidentally observed in each observation metabolically classified by oxycodone/oxymorphone and oxycodone/noroxycodone ratios were calculated when sufficient data were available. The Wilcoxon test was used to assess for statistical significance between fast and normal metabolizers and between normal and slow metabolizers.
Data cleaning and statistical analysis were performed in the R studio using the R language [30,31]. Significance testing was performed using the wilcox.test() command in R. Graphs was generated using the ggplot package.
Results
Establishing Oxycodone/Metabolite Ratio Reference Ranges
Individuals with 3 or more observations and an intra-patient Oxycodone/metabolite ratio with a coefficient of variation of less than 10% were considered to have a stable metabolic rate and included in the population used to develop the reference range (Figure 1C). Log10 transformation of each patient?s median Oxycodone/Oxymorphone ratio (corresponding to CYP2D6 activity) shows a primary peak as well as a secondary population of ?slow? metabolizers (Figure 2A). The presence of a distinct population of CYP2D6 slow metabolizers is consistent with the measured frequency of CYP2D6 slow metabolizers using genetic methods [29]. Thus, asymmetric limits were used: the value of the 5th percentile Oxycodone/Oxymorphone ratio was used to define the upper limit of CYP2D6 fast metabolizers and the 90th percentile value was used to define the lower limit of CYP2D6 slow metabolizers. Log10 transformation of each patient?s median Oxycodone/Noroxycodone ratio (corresponding to CYP3A4/5 activity) shows only a primary peak (Figure 2B). Thus, the value of the 5th percentile Oxycodone/Noroxycodone ratio was used to define the upper limit of CYP3A4/5 fast metabolizers and the 95th percentile value was used to define the lower limit of CYP3A4/5 slow metabolizers.
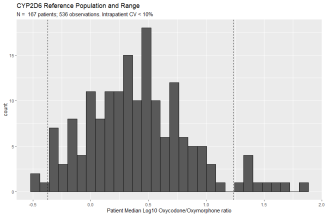 Figure 2A: Oxycodone/ Oxymorphone Metabolic Ratio Reference Range. Frequency histogram of predicted CYP2D6 activity based on Oxycodone/Oxymorphone metabolic ratio. The stable population consists of 536 observations from 167 patients with an intra-patient coefficient of variation less than 10%. Y-axis is the number of patients and x-axis is the log10 transformation of each patient?s median oxycodone/oxymorphone ratio. 5th and 90th percentile values are denoted by vertical dashed lines. The 5th percentile cut-off (95% confidence interval) is 0.42 (0.33 ? 0.51). The 90th percentile (95% CI) cut-off is 17.2 (12.6 ? 26.7).
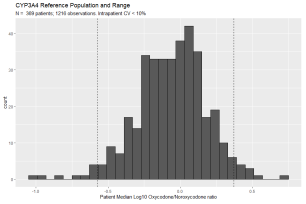 Figure 2B: Oxycodone/Noroxycodone Metabolic Ratio Reference Range. Histogram of predicted CYP3A4/5 activity based on Oxycodone/Noroxycodone metabolic ratio. The stable population consists of 1,216 observations from 369 patients with an intra-patient coefficient of variation of less than 10%. Y-axis is the number of patients and x-axis is the log10 transformation of each patient?s median oxycodone/noroxycodone. 5th and 95th percentile values are denoted by vertical dashed lines. The 5th percentile cut-off (95% confidence interval) is 0.27 (0.22 ? 0.31). The 95th percentile cut-off (95% CI) is 2.36 (2.14 ? 2.81).
Observation of Coincident Drug Metabolite Ratios
164,020 observations from 68,570 patients were categorized as CYP2D6 fast, normal, or low based on the oxycodone/ oxymorphone ratio of the observation and CYP3A4/5 fast, normal, or slow based on oxycodone/ noroxycodone ratio of the observation (Figure 1D). These observations were performed utilizing a multiplexed LC-MS based method of drug detection and coincidentally included other drug-metabolite pairs. Of note, dextromethorphan/dextrorphan, a drug/metabolite pair that is canonically utilized for the determination of CYP2D6 metabolism, shows a significantly lower metabolic ratio for those observations with a predicted slow CYP2D6 metabolism (Figure 3A) and a significantly higher metabolic ratio for those observations with a predicted fast CYP2D6 metabolism (Figure 3B). In contrast, the observed ratio of 6-MAM to morphine, which does not depend on CYP450 oxidation, shows no correlation with predicted CYP2D6 or CYP3A4/5 metabolism (Figures 3C & 3D). Median drug/metabolite ratios for other coincidentally detected pairs are shown in Table 1.
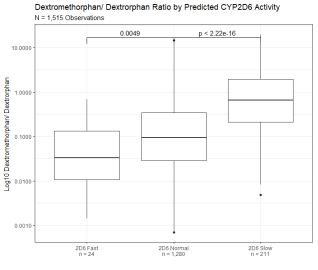 Figure 3A: Dextromethorphan/ Dextrorphan Metabolic Ratio Segmented By Predicted CYP2D6 Activity. Dextromethorphan/ dextrorphan metabolic ratio of 1,515 observations segmented by predicted CYP2D6 activity based on oxycodone/oxymorphone ratio. Y axis is log10 transformation of dextromethorphan/ dextrorphan metabolic ratio. Observations are binned based on predicted CYP2D6 fast activity (oxycodone/ oxymorphone ratio below 5th percentile of the reference range), CYP2D6 normal activity (oxycodone/ oxymorphone ratio within 5th and 90th percentile), and CYP2D6 slow activity (oxycodone/ oxymorphone ratio above 90th percentile of the reference range). Box indicates the median and interquartile range (IQR). Whisker is 1.5 length of IQR. P values derived from Wilcoxon tests are displayed above CYP2D6 segments.
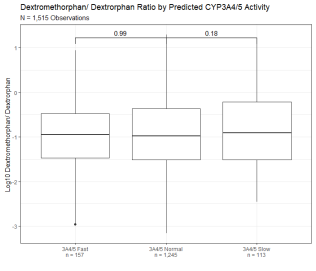 Figure 3B: Dextromethorphan/ Dextrorphan Metabolic Ratio Segmented By Predicted CYP3A4 Activity. Dextromethorphan/ dextrorphan metabolic ratio of 1,515 observations segmented by predicted CYP3A4/5 activity based on oxycodone/noroxycodone ratio. Y axis is log10 transformation of dextromethorphan/ dextrorphan metabolic ratio. Observations are binned based on predicted CYP3A4/5 fast activity (oxycodone/ noroxycodone ratio below 5th percentile of the reference range), CYP3A4/5 normal activity (oxycodone/ noroxycodone ratio within 5th and 95th percentile), and CYP3A4/5 slow activity (oxycodone/noroxycodone ratios above 95th percentile of the reference range). Box indicates the median and interquartile range (IQR). Whisker is 1.5 length of IQR. P values derived from Wilcoxon tests are displayed above CYP3A4/5 segments.
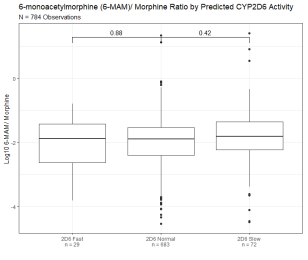 Figure 3C: 6-monoacytylmorphine/ Morphine Metabolic Ratio Segmented By Predicted CYP2D6 Activity. 6-monoacytylmorphine/ morphine metabolic ratio of 784 observations segmented by predicted CYP2D6 activity based on oxycodone/oxymorphone ratio. Y axis is log10 transformation of dextromethorphan/ dextrorphan metabolic ratio. Box indicates the median and interquartile range (IQR). Whisker is 1.5 length of IQR. P values derived from Wilcoxon tests are displayed above CYP2D6 segments.
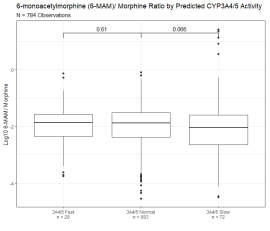 Figure 3D: 6-monoacytylmorphine/ Morphine Metabolic Ratio Segmented by Predicted CYP3A4 Activity. 6-monoacytylmorphine/ morphine metabolic ratio of 784 observations segmented by predicted CYP3A4/5 activity based on oxycodone/noroxycodone ratio. Y axis is log10 transformation of dextromethorphan/ dextrorphan metabolic ratio. Box indicates median and interquartile range (IQR). Whisker is 1.5 length of IQR. P values derived from Wilcoxon tests are displayed above CYP3A4/5 segments.
A subset of patients had sufficient observations for the identification of a metabolic trend. Patient A had 9 observations of oxycodone, oxymorphone, and noroxycodone between December 5, 2016, and September 16, 2017 (Figure 4A). All the patient?s observations had oxycodone/oxymorphone ratios above the normal range suggesting a consistent slow CYP2D6 metabolic rate. All the patient?s observations had oxycodone/noroxycodone ratio within the normal range suggesting a consistent normal CYP3A4/5 metabolic rate. The absolute oxycodone value was between 1,665 and 21,788 ng/mL suggesting that the observed metabolic ratios were not simply a product of time from dosage.
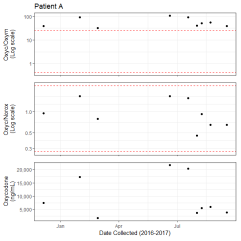 Figure 4A: Observations of Patient with Likely CYP2D6 Slow Metabolism. Longitudinal observations of patient A. Observations are indicated by dots. Y axis of the top panel is log10 of the oxycodone/ oxymorphone ratio (Oxyc/Oxym). Red dashed lines indicate the 5th and 90th percentiles of the reference range. Y axis of the middle panel is log10 transformation of the oxycodone/ noroxycodone ratio (Oxyc/Norox). Red dashed lines indicate the 5th and 95th percentiles of the reference range. The Y-axis of the bottom panel is the oxycodone value in ng/mL. The shared x-axis is the collection time for each observation.
Of the patients with multiple observations, some also showed clear evidence of specimen tampering. Patient B had 20 observations between December 2, 2016 and September 17, 2018 (Figure 4B). During this time the observed oxycodone/oxymorphone and oxycodone/noroxycodone ratios were exceedingly high ? several orders of magnitude above the reference range. Additionally, most of the patient?s observations showed a very high absolute value of oxycodone (median = 148,087 ng/mL, IQR = 121,914 ng/mL). The few observations with drug/metabolites ratios within the reference range had lower oxycodone values between 1,663 and 7,161 ng/mL. In aggregate, these observations are most consistent with contamination of the urine specimen with oxycodone, although another phenomenon may have caused these results.
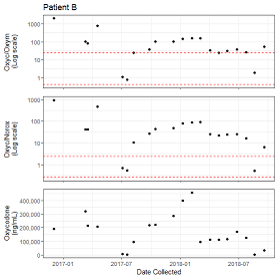 Figure 4B: Observations of Patient with Likely Specimen Tampering. Longitudinal observations of patient B. Panel axes are similar to Figure 4A.
Discussion
The CYP2D6 and CYP3A4/5 enzymes are responsible for intermediate steps in the metabolism of about half of all prescribed drugs [32]. Per the US FDA, pharmacogenomics can be used to aid therapeutic strategy, determine appropriate dosage, or assess the likelihood of therapeutic benefit or toxicity for many commonly prescribed drugs [33]. High costs and technical challenges of pharmacogenomics testing have limited their clinical use (ref). Thus, we propose a method of phenotypic identification of patients with aberrant drug metabolism utilizing observations from routine therapeutic drug monitoring.
The concentration of drug excreted by patients in random urine specimens varies considerably over time possibly making statistical calculations too variable for acceptable confidence limits. We addressed this issue by considering the metabolic ratios in the same patient on the same specimen and determining if they were consistent within 10 percent over at least three collections thus minimizing this variable. A second factor was our large database allowing more statistical certainty.
Urine metabolic ratios are known to be useful in therapeutic drug monitoring as an aid to interpretation or to detect specimen adulteration [34]. A strong correlation between urine metabolic ratios and CYP2D6 or CYP3A4/5 genotypes when measured in a well-controlled setting (i.e. known dose and known time from dose to specimen collection) has been reported [14-25]. Our data is derived from a less-controlled setting given that both dose, time from dose, and other substances ingested are largely unknown in our population. Despite the less-controlled setting of urine drug testing relatively stable metabolic ratios have been reported in this setting as well [35-37]. We were able to control for these unknowns when developing our reference range by choosing patients with multiple observations (3 or more) and low intra-patient variability (coefficient of variation less than 10%). Presumably, the differences in metabolic ratio among these ?stable? patients are due to congenital variation in metabolic rates and not changes in behavior (i.e. change in dosing schedule).
We utilize a ?fast/normal/slow? nomenclature to describe aberrant metabolizers, which is different than the ?poor/intermediate/extensive/ultra-rapid? ?poor/intermediate/extensive? nomenclatures typically used to describe CYP2D6 and CYP3A4/5 metabolic rates, respectively [38]. We utilize a different nomenclature because 1) we believe that it more clearly describes the phenomenon of interest and 2) we are unable to discern extensive vs ultra-rapid metabolizers using our method. Given the rarity of CYP2D6 ultra-rapid metabolizers and the dramatic clinical consequences of opioid therapy in this group, it is likely that there are no ultra-rapid metabolizers in our population [39,40].
The relative prevalence of CYP2D6 metabolizers seen in our population of 164,024 observations (3.4% fast, 88.9% normal and 7.6% slow metabolizers) is consistent with allele frequency studies for CYP2D6 [29,41-43]. Similarly, the relative prevalence of CYP3A4/5 metabolizers seen in our population of 164,024 observations (7.2% fast, 85.7% normal and 7.1% slow metabolizers) is consistent with allele frequency studies for CYP3A4/5 [31,44]. While molecular methods would ideally be used to confirm the predicted genotype this experimental approach is not feasible with the specimen types available.
We chose to utilize the metabolic ratios of oxycodone/ oxymorphone and oxycodone/ noroxycodone to a) have enough patients displaying ?stable? metabolic ratios to develop a reference range and b) identify aberrant metabolizers for two enzymatic pathways (CYP2D6 and CYP3A4/5) to test our predicted CYP2D6 and CYP3A4/5 metabolic rates with co-incident drug/metabolite pairs. Conversion of dextromethorphan to dextrorphan is a classic metabolic step mediated by CYP2D6 [45]. We demonstrate that the dextromethorphan/ dextrorphan metabolic ratio correlates well with predicted CYP2D6 activity (Figure 3A) and not with predicted CYP3A4/5 activity (Figure 3B). Overall, the correlation between our predicted CYP2D6 and CYP3A4/5 with the metabolic ratios of other drugs/metabolite pairs is mixed (Table 1). The cytochrome P450 family of enzymes recognizes a diversity of chemical moieties as substrates, thus, it is challenging to discern which specific gene products are contributing to in vivo drug metabolism. In vitro experiments using recombinant CYP isoforms show that many non-canonical CYPs can contribute to drug metabolism pathways [46,47].
Identification of metabolic ratios outside of an established reference range could alert prescribing clinicians to the possibility of abnormal metabolism that may produce unexpected outcomes with changes to drug exposure, such as dextromethorphan toxicity in CYP2D6 poor metabolizers [48]. For example, the patient shown in Figure 4A is likely to be a CYP2D6 poor metabolizer. Additionally, using aberrant metabolic ratios identified during routine drug testing could be used as a screening tool to guide subsequent pharmacogenomic testing would increase the diagnostic yield of such testing. Lastly, establishing a reference range for metabolic ratios could be used to identify specimen tampering, such as that seen in Figure 4B, with more consistency between laboratories [49].
Table 1: Median drug/metabolite ratios for other coincidentally detected pairs.
Drug/ Metabolite (N)
Enzyme (reference)
2D6 fast
2D6 norm
2D6 slow
3A4 fast
3A4 norm
3A4 slow
Oxycodone / Oxymorphone
(165,793)
2D6[26]
N
5,735
152,010
8,048
11,830
142,214
11,749
% total
3.5%
91.7%
4.9%
7.1%
85.8%
7.1%
Median
0.32
2.51
43.52
1.00
2.52
7.06
IQR
0.13
3.81
41.31
1,71
4.16
15.48
p
2.2E-16
2.2E-16
2.2E-16
2.2E-16
Oxycodone / Noroxycdone
(165,793)
3A4/5[26]
N
5,735
152,010
8,048
11,830
142,214
11,749
% total
3.5%
91.7%
4.9%
7.1%
85.8%
7.1%
Median
0.32
0.84
1.50
0.20
0.84
3.14
IQR
0.30
0.79
1.85
0.08
0.68
1.70
p
2.2E-16
2.2E-16
2.2E-16
2.2E-16
Buprenorphine/
Norbuprenorphine
(5,243)
3A4/5[50]
N
355
4,642
246
716
4,044
483
% total
6.8%
88.5%
4.7%
13.7%
77.1%
9.2%
Median
0.322
0.33
0.41
0.36
0.33
0.31
IQR
0.48
0.47
0.59
0.52
0.47
0.34
p
0.97
0.045
0.0080
0.051
Fentanyl/ Norfentanyl
(7,352)
3A4/5[51]
N
221
6,807
504
783
6,101
648
% total
2.9%
90.4%
6.7%
10.4%
81.0%
8.6%
Median
0.092
0.18
0.21
0.081
0.18
0.36
IQR
0.14
0.26
0.26
0.11
0.25
0.53
p
2.2E-16
2.2E-16
0.0023
2.2E-16
Methadone/ EDDP
(10,645)
Mixed CYP[52]
N
195
9,812
638
1,515
8,326
804
% total
1.8%
92.2%
6.0%
14.2%
78.2%
7.6%
Median
0.21
0.44
0.43
0.25
0.46
0.58
IQR
0.30
0.49
0.49
0.29
0.49
0.73
p
2.2E-16
2.2E-16
0.49
2.2E-16
Hydrocodone/ Norhydrocodone
(18,113)
3A4/5[53,54]
N
405
16,437
1,271
969
14,883
2,261
% total
2.2%
90.8%
7.0%
5.4%
82.2%
12.5%
Median
0.50
0.67
0.75
0.35
0.65
1.02
IQR
0.63
0.62
0.62
0.41
0.57
0.85
p
2.2E-16
2.2E-16
2.1E-9
2.2E-16
Hydrocodone/ Hydromorphone
(12,164)
3A4/5[53,54]
N
383
11,248
533
845
9,997
1,322
% total
3.2%
92.5%
4.4%
7.0%
82.2%
10.9%
Median
0.96
2.39
8.18
2.91
2.32
2.36
IQR
1.78
5.52
46.41
7.21
5.55
5.96
p
2.2E-16
4.56E-5
2.2E-16
0.09
6-MAM/ Morphine
(856)
Mixed esterases[26]
N
31
762
63
154
618
84
% total
3.6%
89.0%
7.4%
18.0%
72.2%
9.8%
Median
0.013
0.013
0.015
0.014
0.013
0.0090
IQR
0.035
0.025
0.038
0.023
0.026
0.023
p
0.88
0.61
0.42
0.066
Amitryptiline/ Nortriptyline
(981)
Mixed CYP[55]
N
24
898
59
56
865
60
% total
2.5%
91.5%
6.0%
5.7%
88.2%
6.1%
Median
27.99
12.02
10.07
19.50
11.83
10.32
IQR
54.89
22.91
11.82
36.12
21.51
21.68
p
1.19E-7
7.76E-11
0.15
0.31
Alprazolam/
Alpha-hydroxyalprazolam
(16,918)
2C9 &
3A4/5[56,57]
N
607
15,335
976
1,285
14,158
1,475
% total
3.6%
90.6%
5.8%
7.6%
83.7%
8.7%
Median
0.34
0.47
0.63
0.35
0.48
0.53
IQR
0.32
0.41
0.51
0.30
0.42
0.50
p
2.2E-16
2.2E-16
2.2E-16
1.4E-5
Clonazepam/
7-amino-clonazepam
(4,728)
3A4/5
N
122
4,255
351
384
3,995
349
% total
2.6%
90.0%
7.4%
8.1%
84.5%
7.4%
Median
0.042
0.035
0.031
0.040
0.035
0.031
IQR
0.039
0.035
0.032
0.047
0.034
0.030
p
2.2E-16
2.2E-16
0.04
0.13
Dextromethorphan/ Dextrorphan
(1,738)
2D6[13,25,58]
N
28
1,566
144
175
1,420
143
% total
1.6%
90.1%
8.3%
10.1%
81.7%
8.2%
Median
0.033
0.093
0.65
0.11
0.10
0.12
IQR
0.13
0.31
1.72
0.30
0.40
0.59
p
3.5E-3
0.65
2.2E-16
0.18
Fluoxetine/ Norfluoxetine
(540)
Mixed CYP[59]
N
1
377
162
49
459
32
% total
0.2%
69.8%
30.0%
9.1%
85.0%
5.9%
Median
0.14
0.87
1.14
1.06
0.92
0.84
IQR
0
0.91
1.20
0.99
0.97
1.64
p
1
3.5E-15
6.9E-6
0.5
Ketamine/ Norketamine
(139)
2B6 & 3A4/5[60,61]
N
4
126
9
15
110
14
% total
2.9%
90.6%
6.5%
10.8%
79.1%
10.1%
Median
5.52
29.77
27.87
13.11
30.64
36.37
IQR
15.36
129.66
40.54
63.58
131.39
106.12
p
0.13
6.1E-5
0.99
0.77
Quietiapine/ Norquietiapine
(597)
2D6 & 3A4/5[62]
N
7
522
68
47
519
31
% total
1.2%
87.4%
11.4%
7.9%
86.9%
5.2%
Median
0.33
0.74
0.58
0.8
0.71
0.72
IQR
0.97
1.29
0.84
1.30
1.22
1.06
p
0.016
1.4E-14
0.03
1
The observations described here demonstrate that the metabolic ratio detected in urine specimens during therapeutic drug monitoring can identify patients with aberrant drug metabolism (i.e. abnormally slow or fast metabolism) and pill shaving. The findings, enabled by a very large data set, are statistically robust. Clinically, the proposed method could be used either to guide drug therapy or pre-screen for further pharmacogenomics testing. Further work to validate this novel approach should include correlation with pharmacogenomic testing.
Conclusion
A reference range of urine metabolic ratio of oxycodone and metabolites can be used to identify patients with aberrant CYP2D6 or CYP3A4/5 metabolic rates as well as specimen contamination. We believe these observations provide the medical necessity for the pharmacogenomic evaluation of these patients.
Conflict of Interest
The authors Nicholas Bevins, Jensen, Kendal J, Horn, Paul S, and Pesce, Amadeo J. are all affiliated with Precision Diagnostics. There is no conflict of interest.
References
1. Centers for Disease Control and Prevention (2022) Precision health: Improving health for each of us and all of us. Genomics & Precision Health. https://www.cdc.gov/genomics/about/precision_med.htm
2. The Dark Report Volume XXIV No. 1 – January 9, 2017. https://www.darkintelligencegroup.com/the-dark-report/laboratory-billing/26-million-recoupment-from-medicare-audit-hammers-pharmacogenomic-lab/
3. Ahmed S, Zhou Z, Zhou J, Chen SQ (2016) Pharmacogenomics of drug metabolizing enzymes and transporters: relevance to precision medicine. Genomics, proteomics & bioinformatics. 14(5):298-313.
https://doi.org/10.1016/j.gpb.2016.03.008
4. Klein K, Zanger UM (2013) Pharmacogenomics of cytochrome P450 3A4: recent progress toward the “missing heritability” problem. Frontiers in genetics. 4:12. https://doi.org/10.3389/fgene.2013.00012
5. Saravanakumar A, Sadighi A, Ryu R, Akhlaghi F (2019) Physicochemical properties, biotransformation, and transport pathways of established and newly approved medications: a systematic review of the top 200 most prescribed drugs vs. the FDA-approved drugs between 2005 and 2016. Clinical pharmacokinetics. 58(10):1281-94. https://doi.org/10.1007/s40262-019-00750-8
6. Taylor C, Crosby I, Yip V, Maguire P, Pirmohamed M, Turner RM (2020) A Review of the Important Role of CYP2D6 in Pharmacogenomics. Genes. 11(11):1295. https://doi.org/10.3390/genes11111295 ;
7. Hicks JK, Bishop JR, Sangkuhl K, Müller DJ, Ji Y, Leckband SG, Leeder JS, Graham RL, Chiulli DL, LLerena A, Skaar TC (2015) Clinical Pharmacogenetics Implementation Consortium (CPIC) guideline for CYP2D6 and CYP2C19 genotypes and dosing of selective serotonin reuptake inhibitors. Clinical Pharmacology & Therapeutics. 98(2):127-34. https://doi.org/10.1002/cpt.147 ;
8. Goetz MP, Sangkuhl K, Guchelaar HJ, Schwab M, Province M, Whirl-Carrillo M, Symmans WF, McLeod HL, Ratain MJ, Zembutsu H, Gaedigk A (2018) Clinical Pharmacogenetics Implementation Consortium (CPIC) guideline for CYP2D6 and tamoxifen therapy. Clinical Pharmacology & Therapeutics. 103(5):770-7. https://doi.org/10.1002/cpt.1007
9. Pratt VM, Scott SA, Pirmohamed M, Esquivel B, Kane MS, Kattman BL, et al., editors. Codeine Therapy and CYP2D6 Genotype. Medical Genetics Summaries. Bethesda (MD): National Center for Biotechnology Information (US); 2012. Available: http://www.ncbi.nlm.nih.gov/books/NBK100662/
10. Abdullah-Koolmees H, Van Keulen AM, Nijenhuis M, Deneer VH (2021) Pharmacogenetics guidelines: overview and comparison of the DPWG, CPIC, CPNDS, and RNPGx guidelines. Frontiers in pharmacology. 11:595219. https://doi.org/10.3389/fphar.2020.595219
11. Fleeman N, Martín Saborido C, Payne K, Boland A, Dickson R, Dundar Y, Fernández Santander A, Howell SJ, Newman WG, Oyee J, Walley T (2011) The clinical effectiveness and cost-effectiveness of genotyping for CYP2D6 for the management of women with breast cancer treated with tamoxifen: a systematic review. 15(33):1-102. https://doi.org/10.3310/hta15330
12. Pratt VM, Cavallari LH, Del Tredici AL, Gaedigk A, Hachad H, Ji Y, Kalman LV, Ly RC, Moyer AM, Scott SA, van Schaik RH (2021) Recommendations for Clinical CYP2D6 Genotyping Allele Selection: A Joint Consensus Recommendation of the Association for Molecular Pathology, College of American Pathologists, Dutch Pharmacogenetics Working Group of the Royal Dutch Pharmacists Association, and the European Society for Pharmacogenomics and Personalized Therapy. The Journal of Molecular Diagnostics. 23(9):1047-64. https://doi.org/10.1016/j.jmoldx.2021.05.013
13. Yu A, Haining RL (2001) Comparative contribution to dextromethorphan metabolism by cytochrome P450 isoforms in vitro: can dextromethorphan be used as a dual probe for both CYP2D6 and CYP3A activities? Drug Metabolism and Disposition. 29(11):1514-20.
14. Sharma A, Pilote S, Bélanger PM, Arsenault M, Hamelin BA (2004) A convenient five-drug cocktail for the assessment of major drug metabolizing enzymes: a pilot study. British journal of clinical pharmacology. 58(3):288-97. https://doi.org/10.1111/j.1365-2125.2004.02162.x
15. Zhu B, Ou-Yang DS, Chen XP, Huang SL, Tan ZR, He N, Zhou HH (2001) Assessment of cytochrome P450 activity by a five-drug cocktail approach. Clinical Pharmacology & Therapeutics. 70(5):455-61. https://doi.org/10.1016/S0009-9236(01)92726-2
16. Turpault S, Brian W, Van Horn R, Santoni A, Poitiers F, Donazzolo Y, Boulenc X (2009) Pharmacokinetic assessment of a five-probe cocktail for CYPs 1A2, 2C9, 2C19, 2D6 and 3A. British journal of clinical pharmacology. 68(6):928-35. https://doi.org/10.1111/j.1365-2125.2009.03548.x
17. Streetman DS, Bleakley JF, Kim JS, Nafziger AN, Leeder JS, Gaedigk A, Gotschall R, Kearns GL, Bertino Jr JS (2000) Combined phenotypic assessment of CYP1A2, CYP2C19, CYP2D6, CYP3A, N-acetyltransferase-2, and xanthine oxidase with the “Cooperstown cocktail”. Clinical Pharmacology & Therapeutics. 68(4):375-83. https://doi.org/10.1067/mcp.2000.109519
18. Ryu JY, Song IS, Sunwoo YE, Shon JH, Liu KH, Cha IJ, Shin JG (2007) Development of the “Inje cocktail” for high-throughput evaluation of five human cytochrome P450 isoforms in vivo. Clinical Pharmacology & Therapeutics. 82(5):531-40. https://doi.org/10.1038/sj.clpt.6100187
19. Rowland A, Mangoni AA, Hopkins A, Sorich MJ, Rowland A (2016) Optimized cocktail phenotyping study protocol using physiological based pharmacokinetic modeling and in silico assessment of metabolic drug–drug interactions involving modafinil. Frontiers in Pharmacology. 7:517. https://doi.org/10.3389/fphar.2016.00517
20. Hakooz NM (2009) Caffeine metabolic ratios for the in vivo evaluation of CYP1A2, N-acetyltransferase 2, xanthine oxidase and CYP2A6 enzymatic activities. Current drug metabolism. 10(4):329-38. https://doi.org/10.2174/138920009788499003 ;
21. Christensen M, Andersson K, Dalén P, Mirghani RA, Muirhead GJ, Nordmark A, Tybring G, Wahlberg A, Ya?ar Ü, Bertilsson L (2003) The Karolinska cocktail for phenotyping of five human cytochrome P450 enzymes. Clinical Pharmacology & Therapeutics. 73(6):517-28. https://doi.org/10.1016/S0009-9236(03)00050-X
22. Blakey GE, Lockton JA, Perrett J, Norwood P, Russell M, Aherne Z, Plume J (2004) Pharmacokinetic and pharmacodynamic assessment of a five-probe metabolic cocktail for CYPs 1A2, 3A4, 2C9, 2D6 and 2E1. British journal of clinical pharmacology. 57(2):162-9. https://doi.org/10.1046/j.1365-2125.2003.01973.x
23. Adedoyin A, Frye RF, Mauro K, Branch RA (1998) Chloroquine modulation of specific metabolizing enzymes activities: investigation with selective five drug cocktail. British journal of clinical pharmacology. 46(3):215-9. https://doi.org/10.1046/j.1365-2125.1998.00765.x
24. Stewart NA, Buch SC, Conrads TP, Branch RA (2011) A UPLC-MS/MS assay of the “Pittsburgh cocktail”: six CYP probe-drug/metabolites from human plasma and urine using stable isotope dilution. Analyst. 136(3):605-12. https://doi.org/10.1039/C0AN00643B
25. Jones DR, Gorski JC, Haehner BD, O'Mara Jr EM, Hall SD (1996) Determination of cytochrome P450 3A4/5 activity in vivo with dextromethorphan N-demethylation. Clinical Pharmacology & Therapeutics. 60(4):374-84. https://doi.org/10.1016/S0009-9236(96)90194-0
26. Smith HS (2009) Opioid Metabolism. Mayo Clin Proc. 84: 613–624. https://doi.org/10.1016%2FS0025-6196(11)60750-7
27. Cua A, Rogers R, Lipnick P, Kilbourn K (2017) Lower cutoffs for LC-MS/MS urine drug testing indicates better patient compliance. Pain Physician. 20:E1107-13.
28. Horn PS, Pesce AJ, Copeland BE (1998) A robust approach to reference interval estimation and evaluation. Clinical chemistry. 44(3):622-31. https://doi.org/10.1093/clinchem/44.3.622
29. Del Tredici AL, Malhotra A, Dedek M, Espin F, Roach D, Zhu GD, Voland J, Moreno TA (2018) Frequency of CYP2D6 alleles including structural variants in the United States. Frontiers in pharmacology. 9:305. https://doi.org/10.3389/fphar.2018.00305
30. RStudio Team. RStudio: Integrated Development Environment for R. Boston, MA: RStudio, PBC.; 2020. http://www.rstudio.com/
31. R Core Team. R: A Language and Environment for Statistical Computing. Vienna, Austria: R Foundation for Statistical Computing; 2020. https://www.R-project.org/
32. Zanger UM, Schwab M (2013) Cytochrome P450 enzymes in drug metabolism: regulation of gene expression, enzyme activities, and impact of genetic variation. Pharmacology & therapeutics. 138(1):103-41. https://doi.org/10.1016/j.pharmthera.2012.12.007
33. Health C for D and R. Table of Pharmacogenetic Associations. FDA. 2021 [cited 2 Jun 2021]. https://www.fda.gov/medical-devices/precision-medicine/table-pharmacogenetic-associations
34. Flood JG (2018) Use of metabolic ratios of drugs in urine for monitoring pain management patients. The Journal of Applied Laboratory Medicine. 2(4):644-7. https://doi.org/10.1373/jalm.2017.023804
35. Barakat NH, Atayee RS, Best BM, Pesce AJ (2012) Relationship between the concentration of hydrocodone and its conversion to hydromorphone in chronic pain patients using urinary excretion data. Journal of analytical toxicology. 36(4):257-64. https://doi.org/10.1093/jat/bks019
36. Leimanis E, Best BM, Atayee RS, Pesce AJ (2012) Evaluating the relationship of methadone concentrations and EDDP formation in chronic pain patients. Journal of analytical toxicology. 36(4):239-49. https://doi.org/10.1093/jat/bks020
37. Yee DA, Best BM, Atayee RS, Pesce AJ. Observations on the urine metabolic ratio of oxymorphone to oxycodone in pain patients. Journal of analytical toxicology. 36(4):232-8. https://doi.org/10.1093/jat/bks022
38. Jurica J, Bartecek R, Zourkova A, Pindurová E, Sulcova A, Kasparek T, Zendulka O (2012) Serum dextromethorphan/dextrorphan metabolic ratio for CYP2D6 phenotyping in clinical practice. Journal of clinical pharmacy and therapeutics. 37(4):486-90. https://doi.org/10.1111/j.1365-2710.2012.01333.x
39. Gasche Y, Daali Y, Fathi M, Chiappe A, Cottini S, Dayer P, Desmeules J (2004) Codeine intoxication associated with ultrarapid CYP2D6 metabolism. New England Journal of Medicine. 351(27):2827-31. N Engl J Med. 2004;351: 2827–2831. https://doi.org/10.1056/NEJMoa041888
40. Haufroid V, Hantson P. CYP2D6 genetic polymorphisms and their relevance for poisoning due to amfetamines, opioid analgesics and antidepressants. Clin Toxicol Phila Pa. 2015;53: 501–510. https://doi.org/10.3109/15563650.2015.1049355
41. Zhou Y, Ingelman-Sundberg M, Lauschke VM (2017) Worldwide distribution of cytochrome P450 alleles: a meta-analysis of population-scale sequencing projects. Clinical Pharmacology & Therapeutics. 102(4):688-700. https://doi.org/10.1002/cpt.690
42. Teh LK, Bertilsson L (2011) Pharmacogenomics of CYP2D6: molecular genetics, interethnic differences and clinical importance. Drug metabolism and pharmacokinetics. 1112190300. https://doi.org/10.2133/dmpk.dmpk-11-rv-121
43. Bradford LD (2002) CYP2D6 allele frequency in European Caucasians, Asians, Africans and their descendants. Pharmacogenomics. 3(2):229-43. https://doi.org/10.1517/14622416.3.2.229
44. Guttman Y, Nudel A, Kerem Z (2019) Polymorphism in cytochrome P450 3A4 is ethnicity related. Frontiers in genetics. 10:224. https://doi.org/10.3389/fgene.2019.00224
45. Gaedigk A, Simon SD, Pearce RE, Bradford LD, Kennedy MJ, Leeder JS (2008) The CYP2D6 activity score: translating genotype information into a qualitative measure of phenotype. Clinical Pharmacology & Therapeutics. 83(2):234-42. https://doi.org/10.1038/sj.clpt.6100406
46. Ducharme J, Farinotti R (1996) Clinical pharmacokinetics and metabolism of chloroquine. Clinical pharmacokinetics. 31(4):257-74. https://doi.org/10.2165/00003088-199631040-00003
47. Venkatakrishnan K, von Moltke LL, Greenblatt DJ (2001). Human drug metabolism and the cytochromes P450: application and relevance of in vitro models. The Journal of Clinical Pharmacology. 41(11):1149-79. https://doi.org/10.1177/00912700122012724
48. Forget P, de Waroux BL, Wallemacq P, Gala JL (2008) Life-threatening dextromethorphan intoxication associated with interaction with amitriptyline in a poor CYP2D6 metabolizer: a single case re-exposure study. Journal of pain and symptom management. 36(1):92-6. https://doi.org/10.1016/j.jpainsymman.2007.09.006
49. Sobolesky PM, Smith BE, Pesce AJ, Fitzgerald RL (2018) Interpretation of pain management testing results using case examples. The Journal of Applied Laboratory Medicine. 2(4):610-21. https://doi.org/10.1373/jalm.2017.024786
50. Elkader A, Sproule B (2005) Buprenorphine. Clinical pharmacokinetics. 44(7):661-80. https://doi.org/10.2165/00003088-200544070-00001
51. Yuan JJ, Hou JK, Zhang W, Chang YZ, Li ZS, Wang ZY, Du YY, Ma XJ, Zhang LR, Kan QC, Candiotti KA (2015) CYP3A4* 1G genetic polymorphism influences metabolism of fentanyl in human liver microsomes in Chinese patients. Pharmacology. 96(1-2):55-60. https://doi.org/10.1159/000433441
52. Volpe DA, Xu Y, Sahajwalla CG, Younis IR, Patel V (2018) Methadone metabolism and drug-drug interactions: in vitro and in vivo literature review. Journal of Pharmaceutical Sciences. 107(12):2983-91. https://doi.org/10.1016/j.xphs.2018.08.025
53. Hutchinson MR, Menelaou A, Foster DJ, Coller JK, Somogyi AA (2004) CYP2D6 and CYP3A4 involvement in the primary oxidative metabolism of hydrocodone by human liver microsomes. British journal of clinical pharmacology. 57(3):287-97. https://doi.org/10.1046/j.1365-2125.2003.02002.x
54. Cone EJ, Darwin WD, Gorodetzky CW, Tan T (1978) Comparative metabolism of hydrocodone in man, rat, guinea pig, rabbit, and dog. Drug Metabolism and Disposition. 6(4):488-93.
55. Zhou SF, Zhou ZW, Yang LP, Cai JP (2009) Substrates, inducers, inhibitors and structure-activity relationships of human Cytochrome P450 2C9 and implications in drug development. Current medicinal chemistry. 16(27):3480-675. https://doi.org/10.2174/092986709789057635
56. Greenblatt DJ, Wright CE (1993) Clinical pharmacokinetics of alprazolam. Clinical pharmacokinetics. 24(6):453-71. https://doi.org/10.2165/00003088-199324060-00003
57. Riss J, Cloyd J, Gates J, Collins S (2008) Benzodiazepines in epilepsy: pharmacology and pharmacokinetics. Acta neurologica scandinavica. 118(2):69-86. https://doi.org/10.1111/j.1600-0404.2008.01004.x
58. Yu A, Dong H, Lang D, Haining RL (2001) Characterization of Dextromethorphan O-andN-Demethylation Catalyzed by Highly Purified Recombinant Human CYP2D6. Drug metabolism and disposition. 29(11):1362-5.
59. Mandrioli R, Forti GC, Raggi MA (2006) Fluoxetine metabolism and pharmacological interactions: the role of cytochrome p450. Current drug metabolism. 7(2):127-33. https://doi.org/10.2174/138920006775541561
60. Hijazi Y, Boulieu R (2002) Contribution of CYP3A4, CYP2B6, and CYP2C9 isoforms toN-demethylation of ketamine in human liver microsomes. Drug Metabolism and Disposition. 30(7):853-8. https://doi.org/10.1124/dmd.30.7.853
61. Rao LK, Flaker AM, Friedel CC, Kharasch ED (2016) Role of cytochrome P4502B6 polymorphisms in ketamine metabolism and clearance. Anesthesiology. 125(6):1103-12. https://doi.org/10.1097/ALN.0000000000001392
62. Le Dare B, Ferron PJ, Allard PM, Clément B, Morel I, Gicquel T (2020) New insights into quetiapine metabolism using molecular networking. Scientific reports. 10(1):1-0. https://doi.org/.1038/s41598-020-77106-x