Information Technology Structure for Urine Drug Testing Reports
Authors: Amadeo J. Pesce*, Nicole Chandler, Gregory Ackerman
Precision Diagnostics LLC, San Diego CA 92121, United States of America
*Correspondence to: Professor. Amadeo J. Pesce, Precision Diagnostics LLC, San Diego CA 92121, USA; E-mail: amadeo.pesce@gmail.com
Received: August 18, 2021; Revision: November 13, 2021; Accepted: November 14, 2021; Published: November 20, 2021
Citation: Pesce AJ, Chandler N and Ackerman G (2021) Information Technology Structure for Urine Drug Testing Reports, 21st Century Pathol, Volume 1 (1): 103
Abstract
Urine drug testing for compliance in the management of patients on chronic opioid therapy otherwise termed pain management requires the laboratory to provide concise interpreted information. The report must integrate patient medications, drug metabolism, and positive quantitative drug findings. The history of the patient's previous tests, conversion to a hydrated standard, specimen validity data and drug-drug interactions. This requires many levels of information integration including drug information tables, conversion of analytical test data into specific quantitative drug observations, formatting all the information into a concise report, integration into drug-drug interaction reports and storage into cloud servers, and visual retrievable software for review of patient trends. We describe here how the data is collected, processed, and integrated into a urine drug test report and stored to be retrieved for additional analyses and most importantly for billing.
Keywords:
Urine drug testing; Drug-drug interaction; Analytical Data Examining and Formatting Software (ASCENT)
Background
Urine drug testing is used to monitor patient compliance with their drug regimen and to detect the use of other medications and illicit drugs. Clinical urine drug testing should therefore be embarked upon only with a sound basic knowledge of the capabilities and limitations of each specific test. Unexpected results should be subjected to appropriate confirmatory testing. Consultative support from a laboratory director, toxicologist, or certified medical review officer is essential [1-3]. The testing laboratory is challenged with the task of testing for the requested drugs and formulating a report that is comprehensive, complete, heuristic, and concise. The resulting accumulated drug test information can also be used to monitor trends in drug usage [4-8]. Proper interpretation of a drug test requires the provider to be knowledgeable in drug metabolism. If possible, the report should highlight the patient?s metabolism of the drugs.
Our drug test monitors 80 drugs or metabolites using LC-MS/MS [9]. Each specimen generates around 5 MB (megabytes) of analytical data which must be analytically correct by comparison to chemical standards, quantified, and reformatted for the final report. If possible previous positive test results should be part of the report to help the provider verify and monitor the patient. To accomplish this extensive use is made of several software systems including preformatted lookup tables, a laboratory information system, (STARLIMS) [10] analytical data examining and formatting software (ASCENT) [11], patient result formatting software (STARLIMS), data storage in the cloud in a retrievable format (MICROSOFT AZURE) [12], and software that allows retrievable visual data and exportable to be suitable for correlation with other databases (MICROSOFT PowerBI) [13].
The drug tests are ordered for several purposes. One is to ensure compliance with the drug regimen and the second is to detect the use of other drugs or agents. The list of drugs/agents is often set by the patient's provider.
Providers are often not proficient in their interpretation of urine drug tests [1-3]. Therefore, the final drug test report must enable the provider to accurately assess the results. The report must include the comparison of the patients? medications with those observed, the relationship of the metabolites observed to the prescribed medications, the history of the patient's compliance and if requested possible drug-drug interactions (Figure 1).
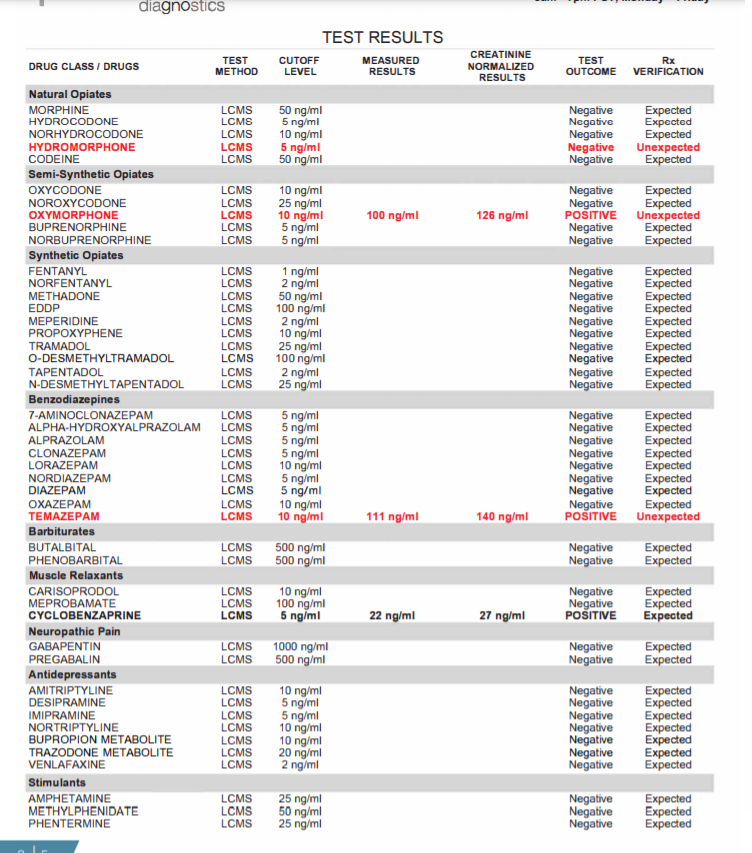
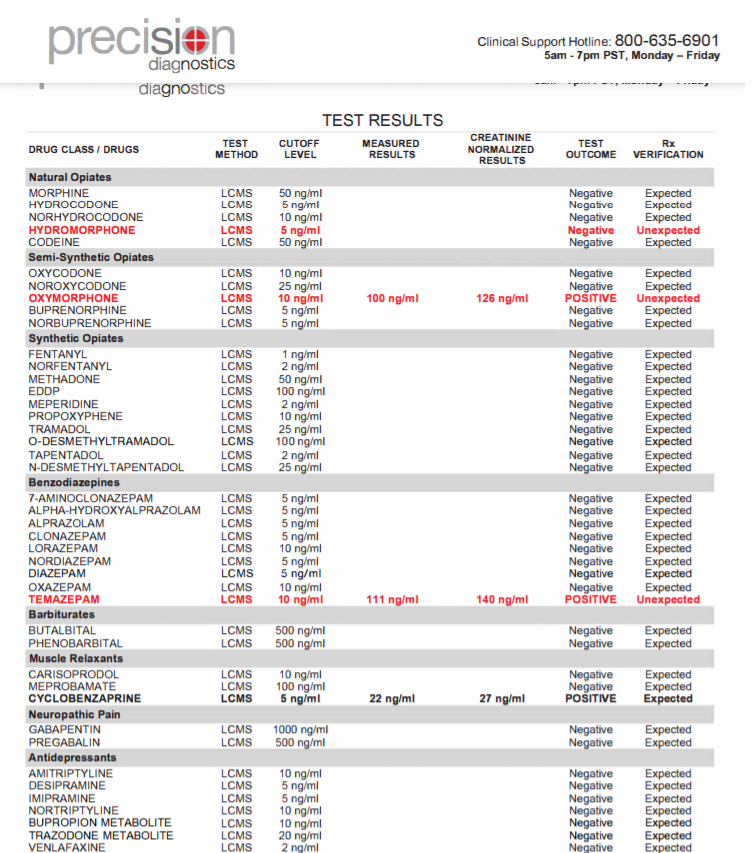
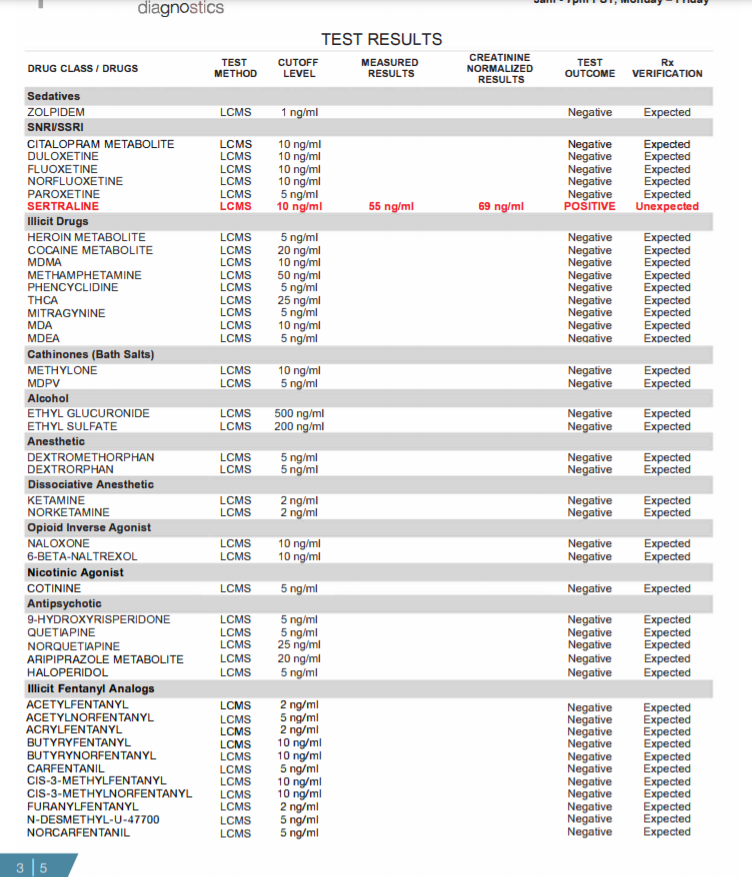
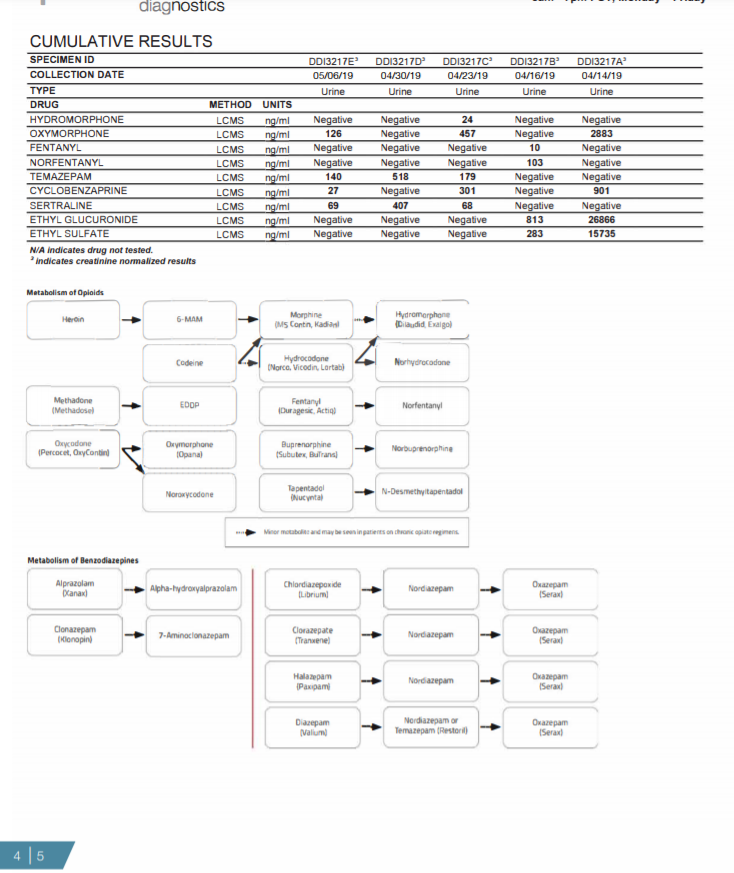
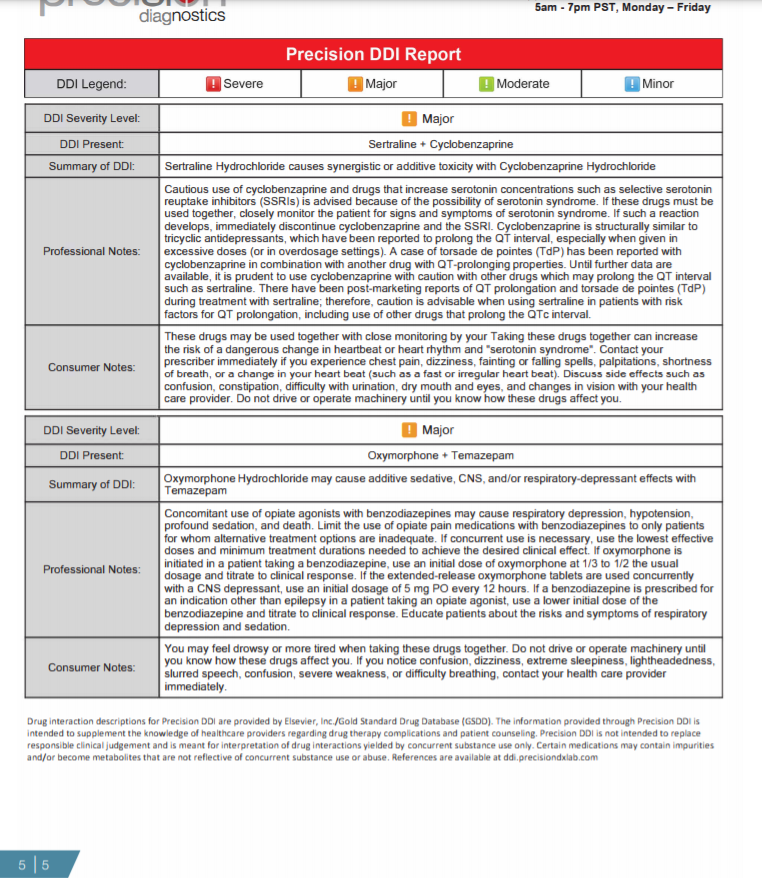
Figure 1: Summary of information provided on each page of the urine drug test report (Pages 1-5).
Page 1: The first page is a summary of the patient?s test results compared to his/her prescription regimen. On the top line the medications prescribed are identified; the analytical findings are summarized as to whether they were expected or unexpected. The first section identifies the consistent results ? this is where the patient tested positive as expected for the drug or drugs prescribed. The next section identifies any unexpected negatives ? drugs that are prescribed but tested negative. The third section identifies any unexpected positives ? drugs that were not prescribed but were found in the patient?s specimen. Below this section are the specimen validity results, which can help identify whether a patient has adulterated his/her urine sample, and if point-of-care testing (POC) is performed in office, those results are entered which allows comparison of the POC results with the laboratory test results.
Pages 2, 3: Every drug that was ordered/tested is displayed here. All unexpected results are displayed in bold red while all expected positives are in bold black. Both measured and creatinine normalized results are included in the report. Creatinine normalized results reduce concentration fluctuations caused by the patient's hydration status.
Page 4: The cumulative report provides a snapshot of the patient's last six test reports. Any drugs detected in the patient?s last 6 specimens are displayed as a creatinine corrected value allowing comparison of test results over time. Below the cumulative report are the metabolism pathways for opioids and benzodiazepines. These pathways only populate on the report if one more opioids or benzodiazepines are positive.
Page 5: The drug-drug interaction (DDI) section of the report identifies major and severe drug combinations present based on the tested drugs that are positive on the report. The Precision DDI Report displays the following: 1) Severity level, 2) Specific combination(s) promoting a DDI, 3) DDI summary.
Methods
In our system, data entry is a manual process. The accession person looks up the patient's history and if there is a previous test request gives the patient that unique identifier. It is important to include information about the time of collection and time of arrival into the laboratory. Data entry uses the STARLIMS system.
To generate the report, the STARLIMS software compares the positive and negative results observed by the INDIGO software to the patient's prescription profile. The expected drugs if positive, are scored as consistent, those that are negative are scored as inconsistent. Further, any positive drugs observed are also scored as inconsistent.
For the final report, all positive drugs observed for the immediate drug test and the 5 previous drug tests are retrieved and added to the final report using the STARLIMS software.
We use ASCENT from Indigo bioautomation (Carmel IN) to analyse our LC-MS/MS data enabling our staff to process 200 to 400 LC analytical runs of 80 drugs/metabolites per day. That is more than 16,000 chromatographic drug analyses per day per Clinical Laboratory Scientist analyst.
Our data is stored in the cloud using Microsoft AZURE and this enables us to process it using Microsoft?s PowerBI visual analytics. Within a minute, the analyst can obtain a report of percent positives for any of our analytes or a combination of two analytes. We also use the Elsevier drug-drug interaction database to alert physicians of this possibility (however, most do not care).
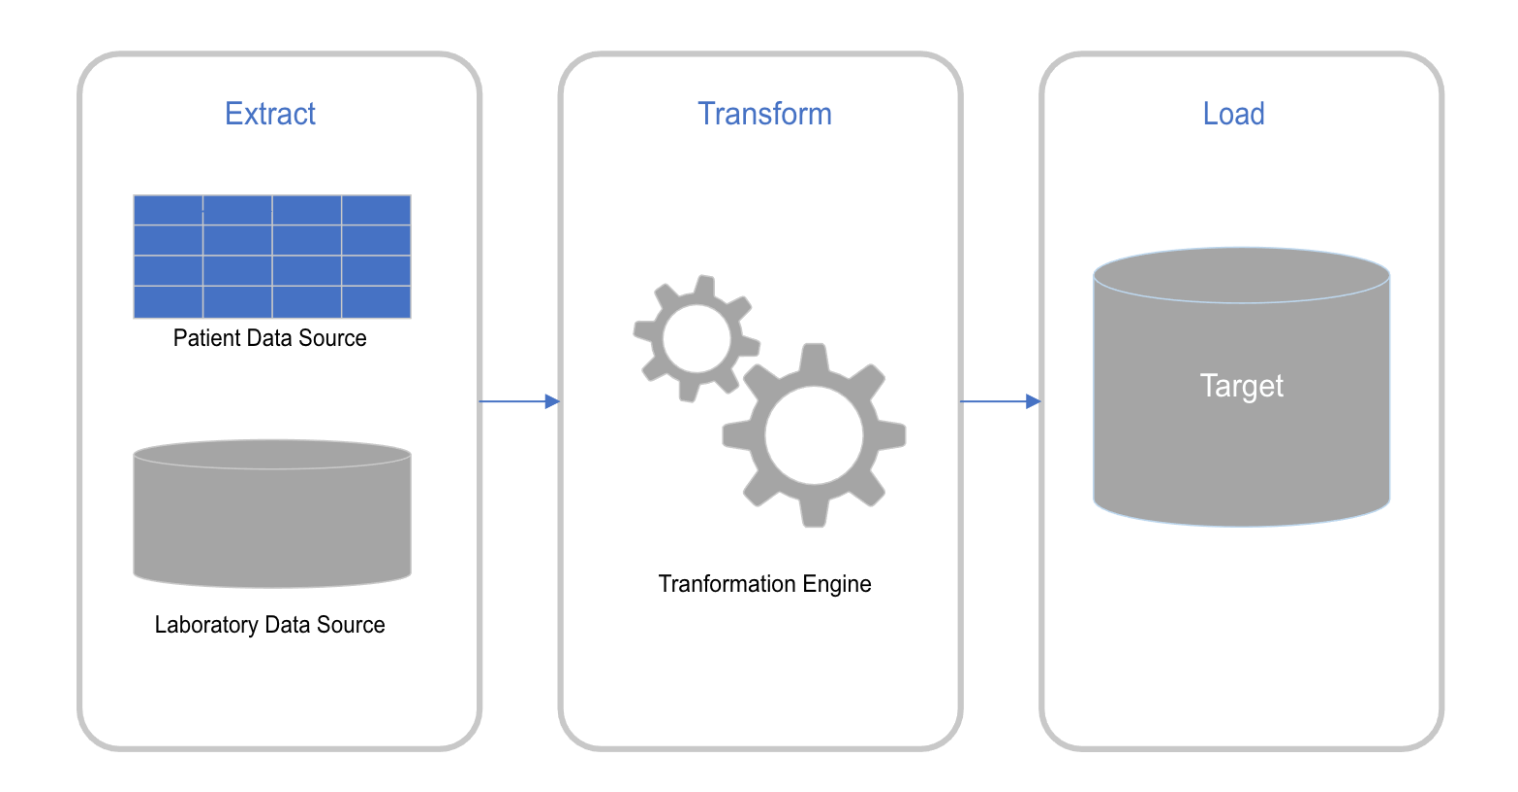
Figure 2: This diagram describes the overall data flow. In our case the patient data source can be electronically entered or manually entered from paper requisitions. The laboratory data source is from the analytical instruments.
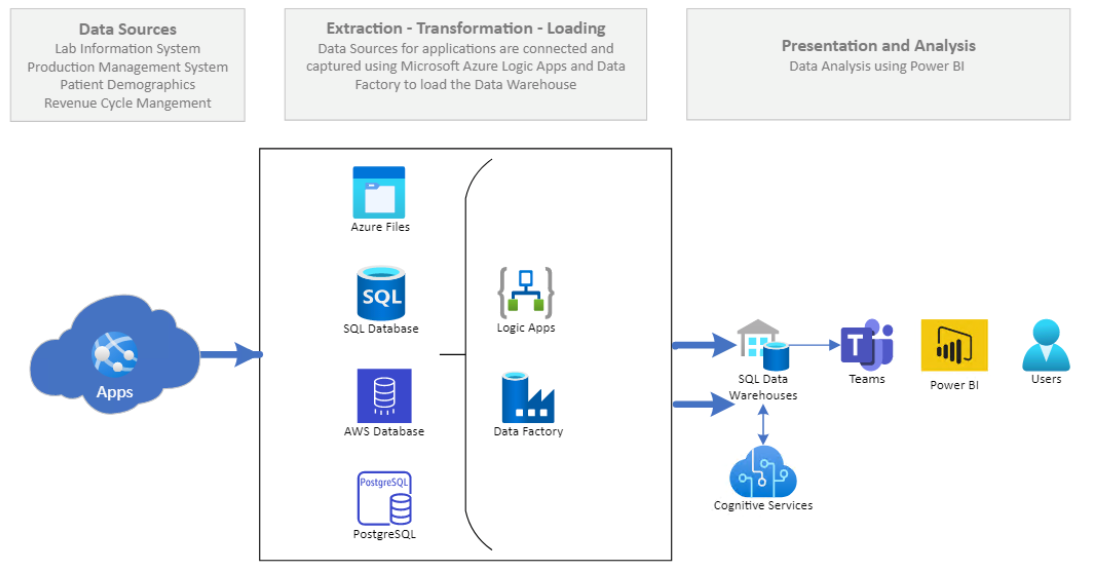
Figure 3: This flow chart shows the next steps in the data flow. The apps include the Indigo application which are loaded into AZURE files, then into the SQL database then into the cloud or AWS database (warehouse). In this group of data software and files logic application software can be applied to this data factory. The information or data stored in the SQL data warehouses can be accessed by programs such as Microsoft Teams and then into visual software such as Microsoft PowerBI for the final user to report.
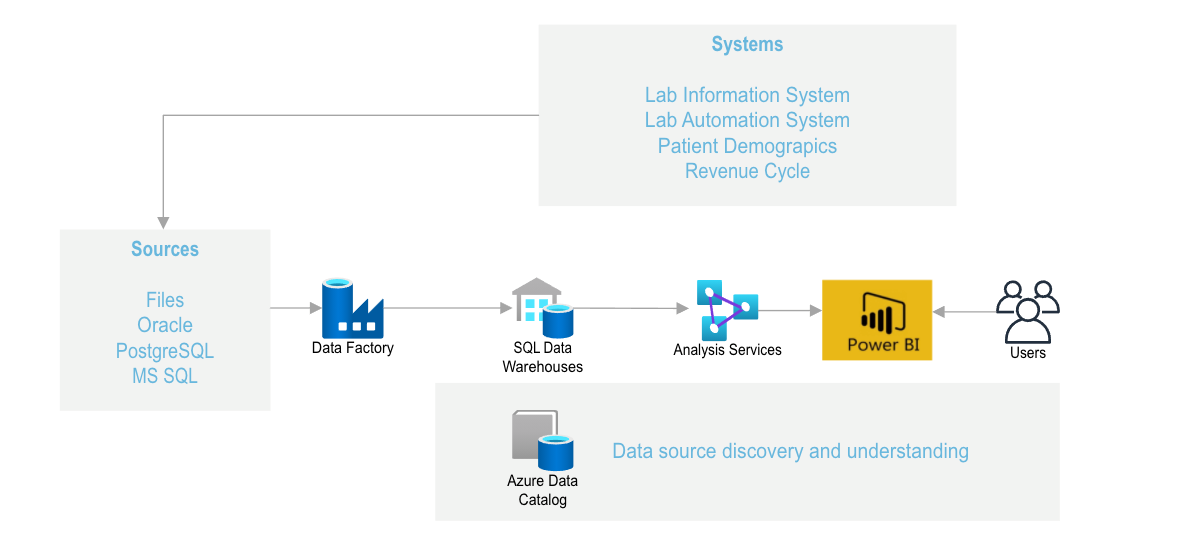
Figure 4: Another way to view the information system is that the files from the Laboratory Information System, the Laboratory information system (which tracks the specimen as it passes through the analytical system) and merges the patient demographics files (which includes patient insurance information that can be downloaded into billing software). The data in the AZURE data catalogue can be accessed and reformatted to yield discovery and understanding of patient behavior.
Data Flow diagrams (Figures 2-4) summarize the data flow.
- Input IT info Patient demographics usually 2 or more identifiers. They are bar coded and separated into aliquots. The Software used here is SARLIMS sold by Abbott Informatics (a subsidiary of Abbott Laboratories). This is a web-based laboratory information management systems (LIMS) - used to manage the collection, processing, storage, retrieval, and analysis of information generated in the laboratory.
- Patient drugs are recorded. These are often recorded as brand names. We developed a lookup these to the generic drugs for reporting purposes. This requires the use of a lookup table with brand names and conversion to the generic formula.
- List of drugs to be tested. The physicians are allowed to choose any of the 80 drugs/metabolites that we test. These are incorporated into the STARLIMS database and will be reported as the results.
- The samples are loaded into our automated test system. The samples are treated to convert them to the non-glucuronidated forms of the test drugs. The drugs are analysed using LC-MS/MS technology. The data generated by these devices is analysed by the ASCENT software from Indigo bioautomation. This converts the instrument ion detection into retention time, mass-ion plots, and detector response.
- These observations are related to the internal standard using the INDIGO software. This identifies the drug from its mass ion and retention time.
- The calibration curve and the INDIGO software convert the drug intensity signal to concentration.
- The patient identifier and the analytical data are downloaded into Starlims to generate the patient report.
- The analytical data is also exported as a CVS file into the ?cloud? where it is stored as Microsoft Azure This is updated daily.
- The stored data is then retrievable as visual data using Microsoft PowerBI. The data from the LC-MS/MS instruments was downloaded from the Indigo ASCENDTM software into an Excel file which was then visualized using Microsoft PoweBITM software.
- The data can be exported in several predetermined formats. These include percent of any of the analytes positive, percent of any two positive analytes, and frequency and concentration of the analytes (Figures 5,6).
- For those physicians who are interested the positive drug tests are sorted into the Elsevier drug-drug interaction database to flag those cases where harm may occur if the two drugs can cause medical interactions [14].
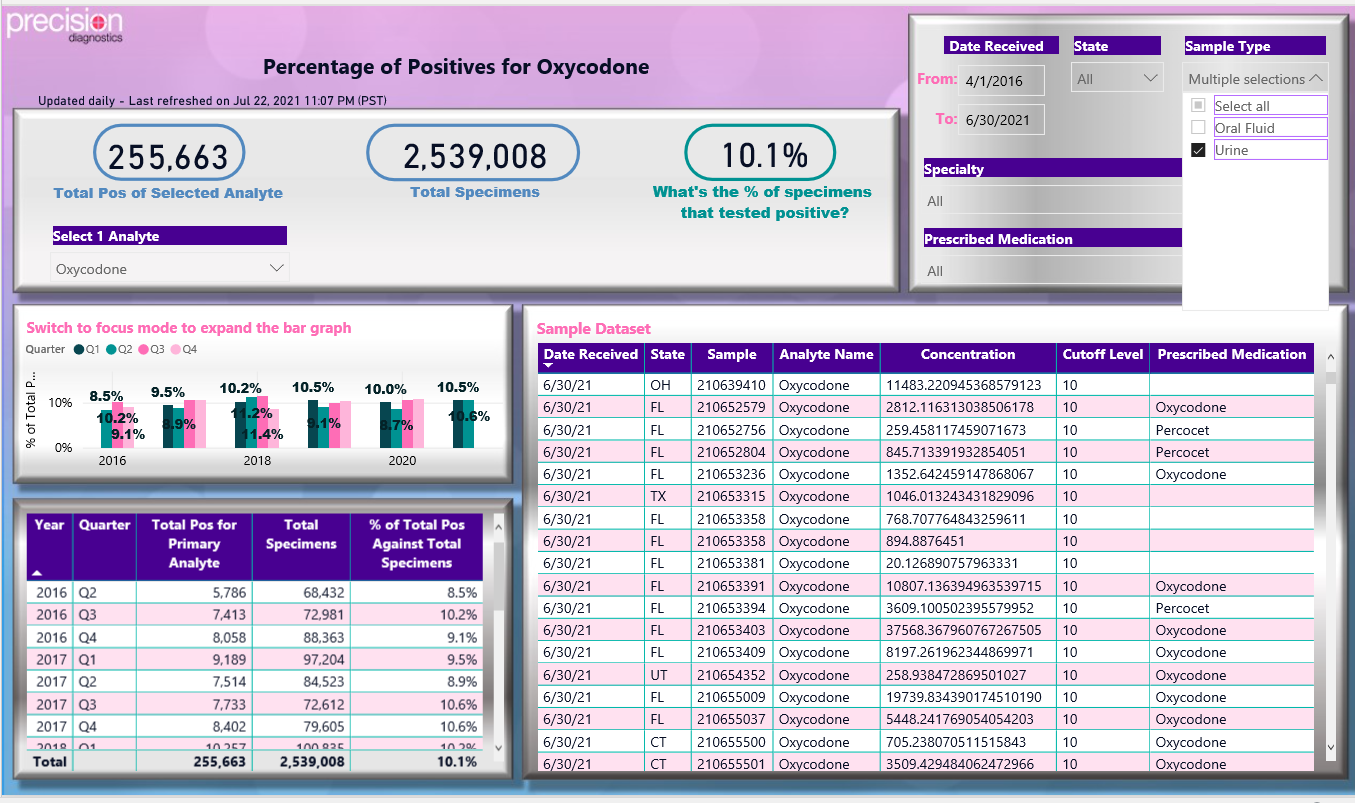
Figure 5: Power BI generated dashboard of drug test results for urine positive tests for oxycodone.
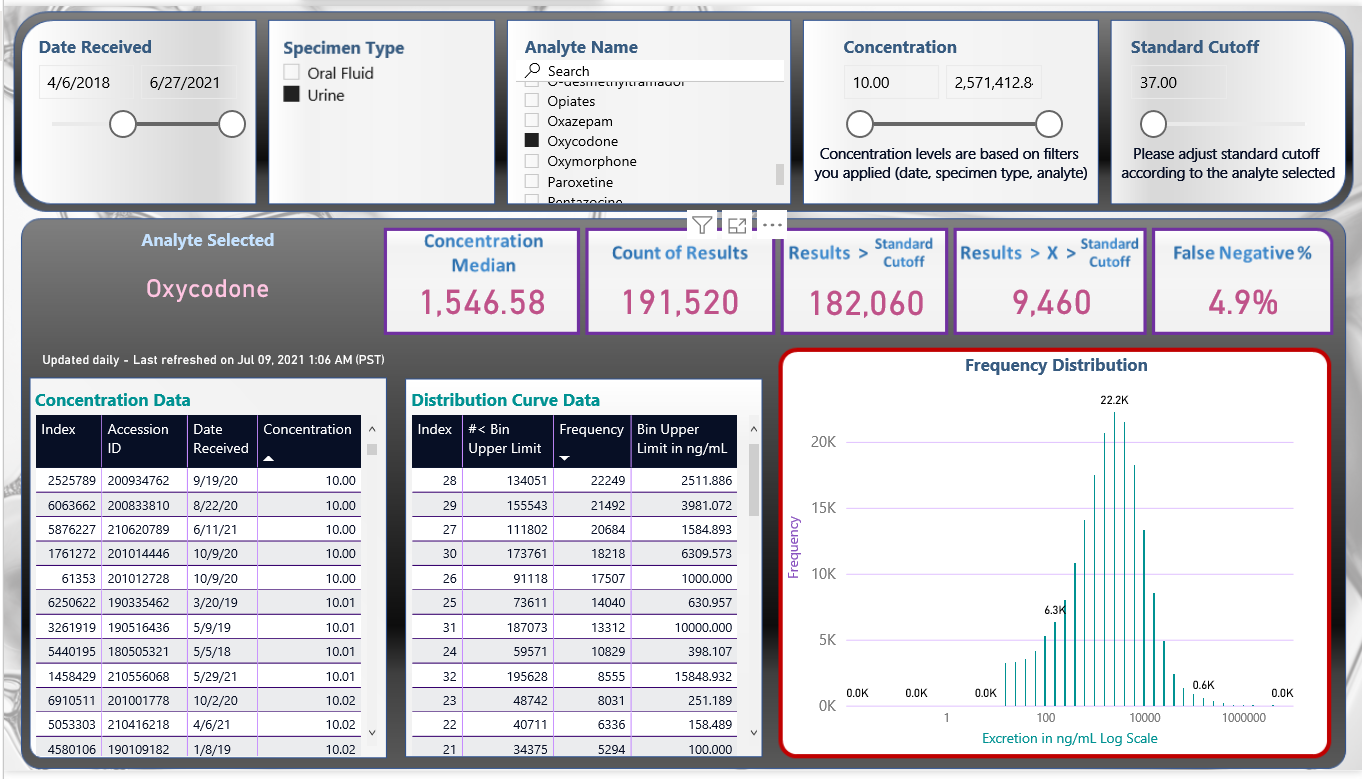
Figure 6: Power BI generated frequency distribution curve of concentration of drug test results positive for oxycodone.
Results and Discussion
As Reisfield GM et al. (2007) have pointed out, ?Urine drug testing can be a valuable component in the care of the patient on chronic opioid therapy, but the interpretation is highly complex and dependent on a host of patient and laboratory variables. Available data suggest serious deficiencies in physicians? abilities to accurately interpret urine drug test results, and the consequences of misinterpretation are potentially serious?.
Therefore, it is necessary for the laboratory report to be as comprehensive as possible and easily interpretable. We describe here our approach to help the patient provider with interpretation tools. We describe the drugs being tested, their metabolites, the method of testing (immunoassay or LC-MS/MS), the quantitative data on the test drug, detection times, whether the drug was expected from the provided prescription data (described as consistent results) and if unexpected drugs were observed (recorded as inconsistent results). Also included are the previously recorded drug test observations which enable the provider to determine the patient?s pattern of drug use, without the necessity of reviewing previous lab tests. As part of the report, we provide metabolism charts of the most encountered opioids and benzodiazepines. In addition, if desired we can provide the provider with information on potential severe drug-drug interactions [14,15].
The importance of having previous results on the report cannot be underestimated. As Bashir has pointed out ?In the clinical care environment, the primary question that a clinician needs addressing is patient compliance: ?Is my patient adhering to their treatment program? I want to know if the positive test result is from old use or new use?. If the physician is following a patient?s adherence, then the sequential urinary concentration of the drug and or metabolite can prove to be helpful as it allows comparison between current and previous results. Following ?spikes? and ?trends? in the urine concentration can often identify when ?new? drug use took place. If the patient is compliant in a rehabilitation treatment program, then the drug concentration of the abused drug MUST decline, although this decline may not be linear due to hydration and/or PK characteristics of the drug? [16].
To meet these needs of the providers, designing and delivering a comprehensive concise urine drug test report requires the integration of several software systems. In our case, these are Abbott Starlims, Indigo Bioautomation, Microsoft Azure, MicrosoftBI, and laboratory designed lookup tables of drugs and metabolites. Examples of our publications using our data systems are references [17-19].
Conclusion
The panelists believe that clinicians should follow manufacturer instructions for specific POC UDM tests and direct any questions about interpreting results to an expert in toxicology or clinical pathology. Laboratories performing UDM have a responsibility to provide clear test results, answer questions, and offer support on clinical decisions. When clinicians are confronted with unexpected results, potential causes for false-positive and false-negative results (e.g., quinolone antibiotics, tolmetin; are important to investigate. A summary of communications and discussions about results with the laboratory and other experts can be included in the medical record to document the medical necessity of testing and related clinical decision-making.
Interpretation of drug screening results should be done with caution, while considering not only the presence or absence of the parent drug but also the pharmacological properties of the parent drug and its metabolites, the analyte concentration, technology used and the potential of sample tampering.
Acknowledgement
There was no funding provided for this paper.
Conflicts of Interest
The authors of this article have no conflicts to disclose.
References
1. Reisfield GM, Salazar E, Bertholf RL (2007) Rational use and interpretation of urine drug testing in chronic opioid therapy. Ann Clin Lab Sci 37: 301-314.
2. Reisfield GM, Bertholf R, Barkin RL, et al. (2007) Urine drug test interpretation: What do physicians know? J Opioid Manag 3: 80-86. https://doi.org/10.5055/jom.2007.0044
3. Moeller KE, Kissack JC, Atayee RS, et al. (2017) Clinical interpretation of urine drug tests: What clinicians need to know about urine drug screens. Mayo Clin Proc 92: 774-796. https://doi.org/10.1016/j.mayocp.2016.12.007
4. Hammett-Stabler CA (2018) C63 laboratory support for pain management programs (1st Edition) Clinical and Laboratory Standards Institute (CLSI).
5. Dowell D, Haegerich TM, Chou R (2016) CDC guideline for prescribing opioids for chronic pain-united states. MMWR Recomm Rep 65: 1-49. https://doi.org/10.15585/mmwr.rr6501e1
6. Kipping K, Maier C, Bussemas H, et al. (2014) Medication compliance in patients with chronic pain. Pain Physician 17: 81-94.
7. Gourlay D, Heit HA (2010) The art and science of urine drug testing. Clin J Pain 26: 358.
https://doi.org/10.1097/ajp.0b013e3181ca90de
8. Bordson SJ, Atayee RS, Ma JD, et al. (2014) Tricyclic antidepressants: is your patient taking them? Observations on adherence and unreported use using prescriber-reported medication lists and urine drug testing. Pain Med 15: 355-363.
https://doi.org/10.1111/pme.12300
9. Krock K, Pesce A, Ritz D, et al. (2017) Lower cutoff for LC-MS/MS urine drug testing indicates better patient compliance. Pain Physician 20: 1107-1113.
10. STARLIMS. Abbott informatics, Hollywood, Florida, USA. Abbott Laboratories StarLims laboratory information system sold by Abbott Laboratories. https://www.starlims.com/int/en/home
11. ASCENT from Indigo bioautomation (Carmel IN). https://www.indigobio.com/ascent
12. AZURE Microsoft. https://docs.microsoft.com/en-us/azure/data-explorer/
13. Stadler JG, Donlon K, Siewert JD, et al. (2016) Improving the efficiency and ease of healthcare analysis through use of data visualization dashboards. Big Data 4: 129-35. https://doi.org/10.1089/big.2015.0059
14. Gold standard drug database, integrated database and clinical support engine. https://www.elsevier.com/solutions/drug-database
15. Argoff CE, Alford DP, Fudin J, et al. (2018) Rational urine drug monitoring in patients receiving opioids for chronic pain: consensus recommendations. Pain Med 19: 97-117. https://doi.org/10.1093/pm/pnx285
16. Kapur BM, Aleksa K (2020) What the lab can and cannot do: clinical interpretation of drug testing results. Crit Rev Clin Lab Sci 57: 548-585. https://doi.org/10.1080/10408363.2020.1774493
17. Nickley J, Kain J, Krock K, et al. (2019) Severe drug-drug interactions: reported and missed. J Clin Toxicol 9: 406. https://doi.org/doi:10.4172/2161-0495.10003406
18. Krock K, Nickley J, Tran K, et al. (2020) Correlation of fentanyl positive drug screens with other medications in patients from pain, rehabilitation and behavioral programs. Ann Clin Lab Sci 50: 260-265.
19. Pesce A, Thomas R, Krock K, et al. (2020) Reduction of dug-drug interaction risk; CDC guidelines influence on opiate benzodiazepine prescribing. Ann Clin Lab Sci 50: 321-326.
